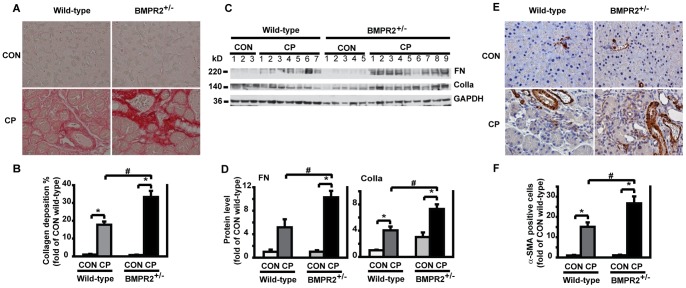
Figure 2. BMPR2 deficiency enhanced pancreatic fibrosis and PSC activation after CP induction.
(A) Representative images of sirius red staining for collagen deposition in the pancreas. (B) Quantification of collagen deposition. CON wild-type: n = 4, CON BMPR2+/−: n = 5, CP wild-type: n = 7, CP BMPR2+/−: n = 9. Original magnification×400. (C) ColIa and FN protein levels in the pancreas by Western blotting. (D) Quantification of ColIa and FN. The protein levels were normalized against GAPDH and quantified as fold of CON wild-type. CON wild-type: n = 4, CON BMPR2+/−: n = 5, CP wild-type: n = 7, CP BMPR2+/−: n = 9. *P<0.05 compared with CON, # P<0.05 compared with CP wild-type. (E) Representative images of immunohistochemistry against α-SMA on paraffin-embedded pancreatic sections. (F) Quantification of α-SMA-positive cells in the periacinar areas. n = 4 mice/group. Original magnification×400. *P<0.05 compared with CON, # P<0.05 compared with CP wild-type.

