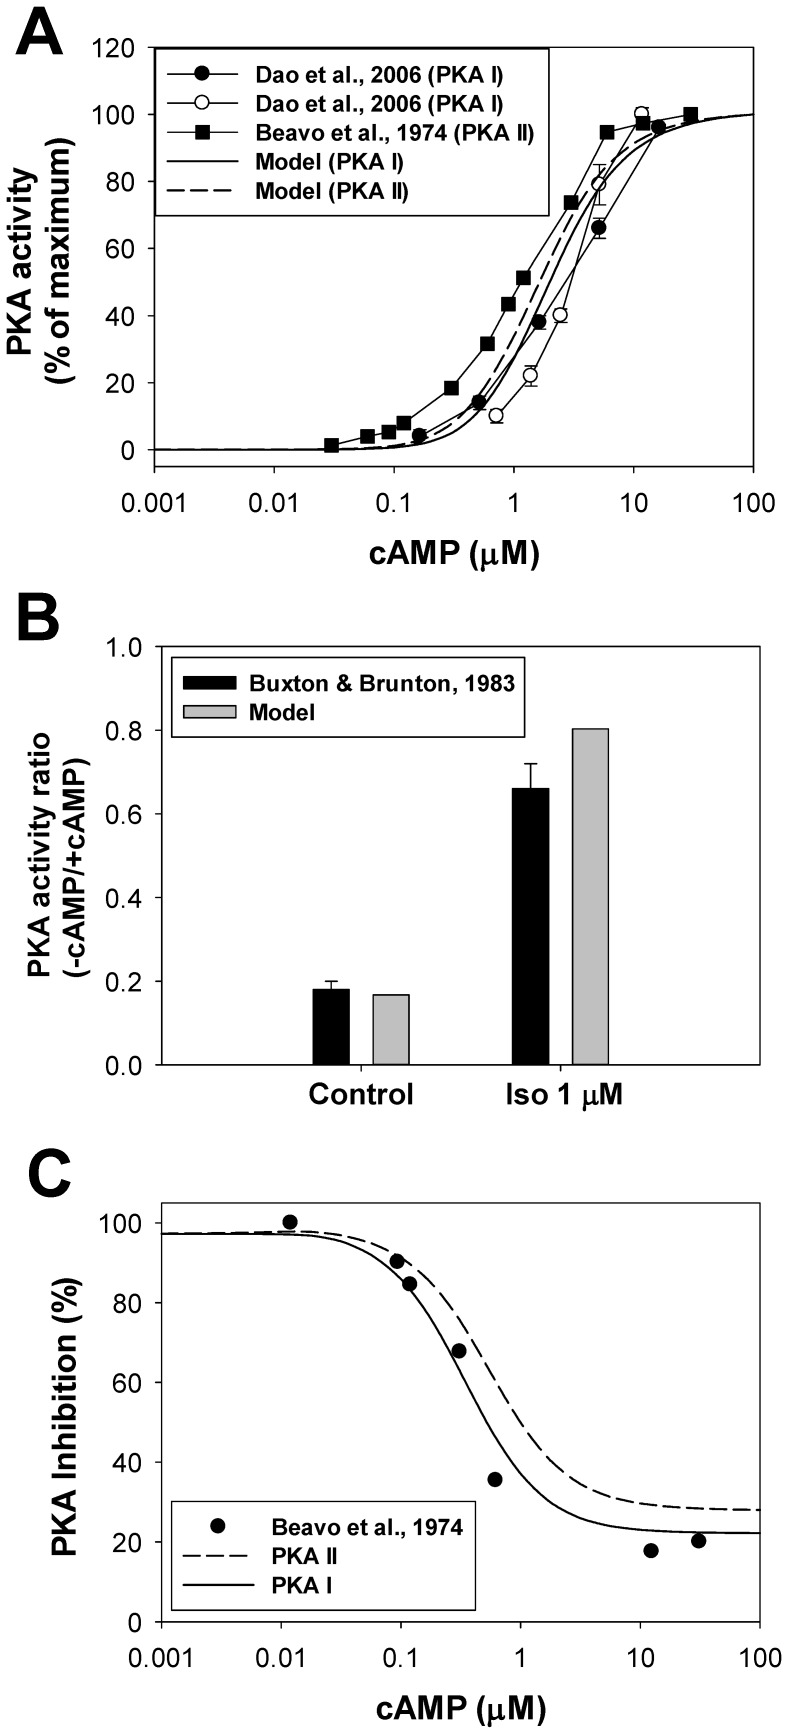
Figure 6. The effects of β1-adrenoceptor stimulation on PKA activities.
Panel A: PKA I and PKA II activities as functions of cAMP. Experimental data for PKA I obtained by two methods are shown by filled and unfilled circles [55]; data for PKA II obtained by Beavo et al. [54]. Corresponding simulated data are shown by a solid (PKA I) and a dashed (PKA II) line. Panel B: PKA activity ratio. Experimental data were obtained without (−cAMP) and with (+cAMP) externally applied 3 µM cAMP, both without and with 1 µM isoproterenol (black bars [57]). We also performed four simulations: no isoproterenol/basic level cAMP (−cAMP), no isoproterenol/3 µM cAMP (+cAMP), 1 µM isoproterenol/no externally applied cAMP (−cAMP), and 1 µM isoproterenol/3 µM cAMP (+cAMP). Then, the corresponding PKA ratios were calculated. Panel C: Protein kinase A inhibition by a heat-stable protein kinase inhibitor PKI. Experimentally, PKA activities were measured with and without PKI at different concentrations of cAMP, then their ratio was calculated (in %) and subtracted from 100% (filled circles, [54]). Corresponding simulation data for PKA I and PKA II are shown by solid and dashed lines. Concentration of [PKI]tot = 2·0.2·[PKA]tot.

