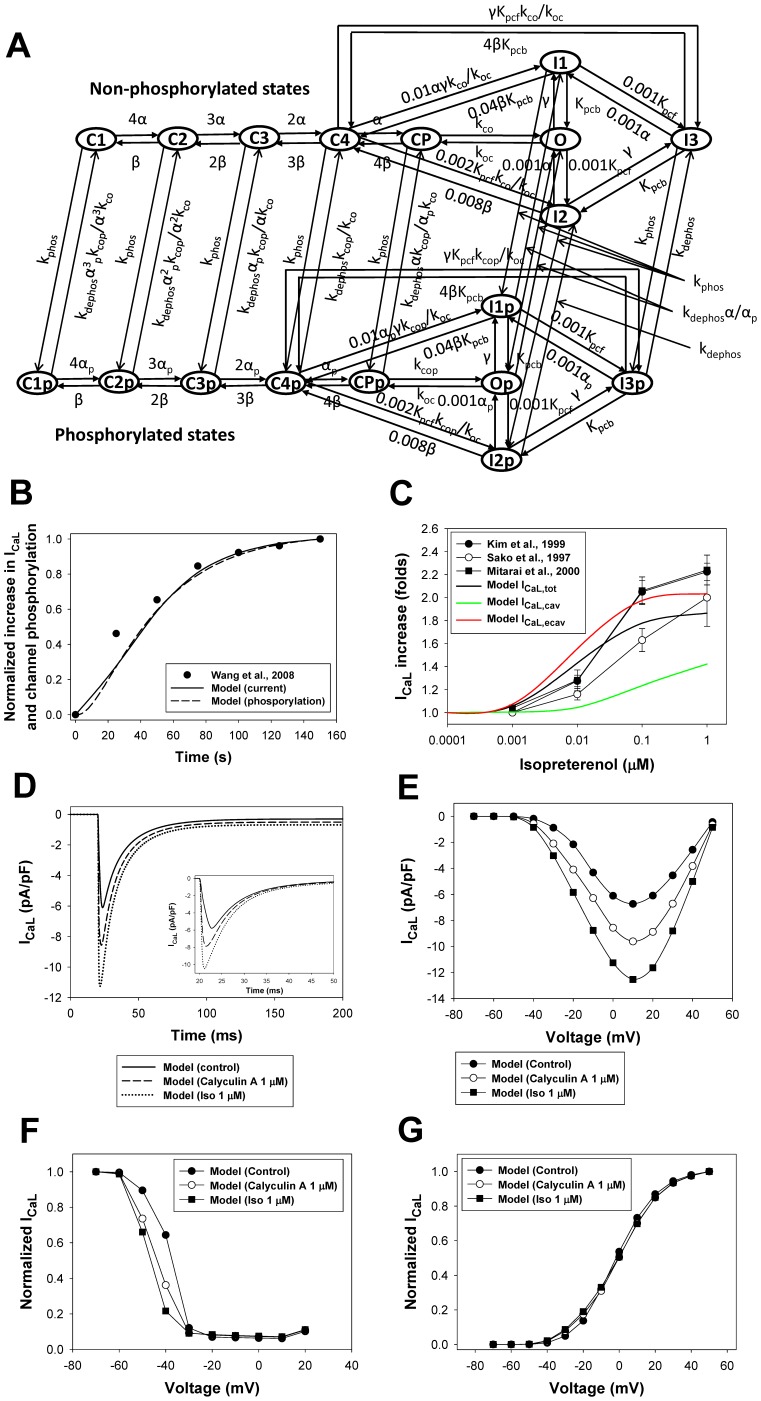
Figure 9. The effects of β1-adrenoceptor stimulation on the L-type Ca2+ current.
Panel A: Markov model of the L-type Ca2+ channel. State diagram consists of two similar sub-diagrams for non-phosphorylated (upper sub-diagram) and phosphorylated states (lower sub-diagram). C1, C2, C3, C4, and CP are closed states; O is the open state; I1, I2, and I3 are inactivated states; C1p, C2p, C3p, C4p, and CPp are closed phosphorylated states; Op is the open phosphorylated state; and I1p, I2p, and I3p are phosphorylated inactivated states. The rate constants α, αp, and β are voltage-dependent; γ is calcium dependent; kco, koc, kcop, Kpcf and Kpcb, are voltage-insensitive; and kphos and kdephos are the phosphorylation and dephosphorylation rates, respectively (see Appendix S1). Panel B: Time course of the peak values of L-type Ca2+ current and L-type Ca2+ channel phosphorylation level upon stimulation with 1 µM isoproterenol. Experimental data for peak ICaL is obtained by a series of pulses to 0 mV for 200 ms from a holding potential of −80 mV with a frequency 0.2 Hz [75]. Modeling data are obtained by a series of pulses to 0 mV for 50 ms from a holding potential of −80 mV with a frequency 0.04 Hz. Increase in phosphorylation level is determined as a fractional increase related to the total increase in phosphorylation of L-type Ca2+ channels at 150th s after application of isoproterenol. Panel C: Peak L-type Ca2+ current as a function of isoproterenol concentration. Experimental data are obtained by Kim et al. [79] (filled circles), Sako et al. [80] (unfilled circles), and Mitarai et al. [81] (filled squares). Simulation data is obtained by a voltage pulse to 0 mV from a holding potential of −80 mV after a 600-second exposure to different concentrations of isoproterenol. Simulation data for the total cellular ICaL,tot, the caveolae-localized ICaL,cav, and the extracaveolae-localized ICaL,ecav are shown by black, green, and red solid lines, respectively. Panel D: Simulated time course of the L-type Ca2+ currents in control (solid line), after 1000-s exposure to PP1/PP2A inhibitor Calyculin A (65% of PP1/PP2A activity inhibition, dashed line), and after 600-s exposure to 1 µM isoproterenol (dotted line). Currents are obtained by a voltage pulses to 0 mV from a holding potential of −80 mV and without Ca2+-induced Ca2+ release to account for heavy buffer conditions. Insert in Panel D: Same simulations performed with intact Ca2+-induced Ca2+ release. Panel E: Peak current-voltage (I–V) relationships for ICaL in control (filled circles) and after exposure to Calyculin A (unfilled circles) and isoproterenol (filled squares). Panel F: Steady-state inactivation relationships for ICaL in control (filled circles) and after exposure to Calyculin A (unfilled circles) and isoproterenol (filled squares). Panel G: Normalized maximum conductance (G/Gmax) for ICaL as functions of voltage in control (filled circles) and after exposure to Calyculin A (unfilled circles) and isoproterenol (filled squares). In Panels E, F, and G, currents are obtained by the two-pulse protocols: a 500-ms depolarizing first pulse to between −70 and +50 mV (in 10-mV increment) is applied from a holding potential of −80 mV; this is followed by a second 500-ms pulse to +10 mV. Simulations are performed without Ca2+-induced Ca2+ release to account for heavy buffer conditions.

