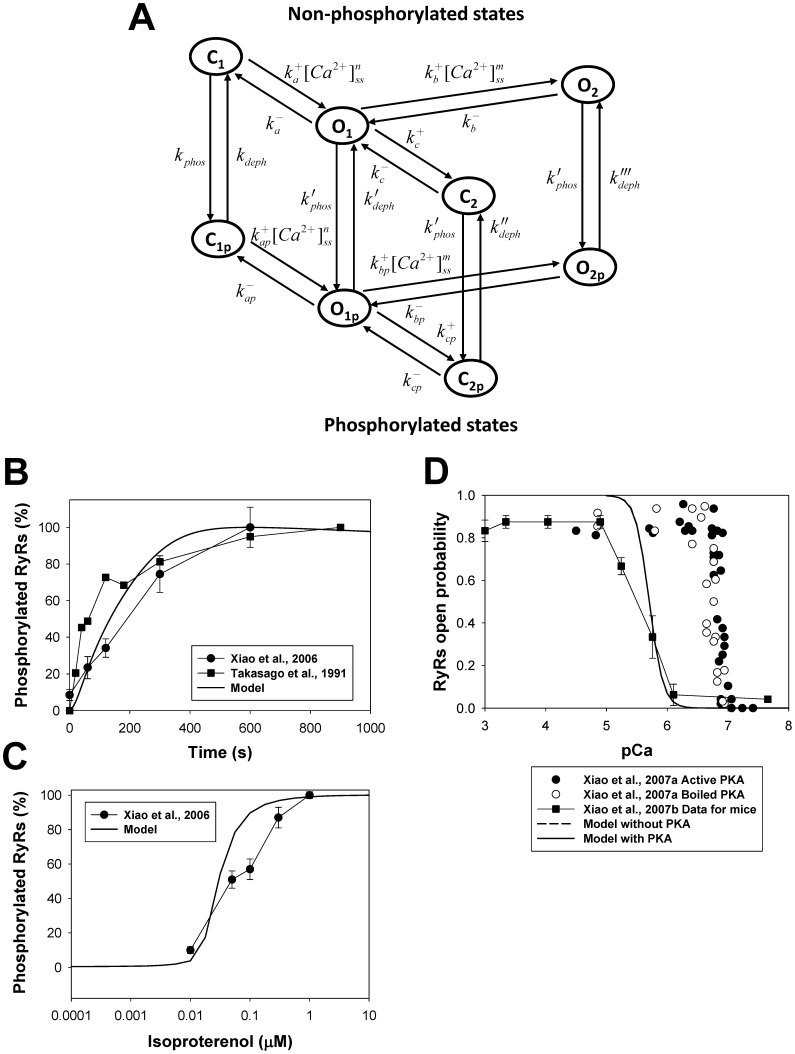
Figure 11. The effects of β1-adrenoceptor stimulation on ryanodine receptors.
Panel A: Markov model of ryanodine receptors. State diagram consists of two similar sub-diagrams for non-phosphorylated (upper sub-diagram) and phosphorylated states (lower sub-diagram). C1 and C2 are closed states; O1 and O2 are open states; C1p and C2p are closed phosphorylated states; O1p and O2p are open phosphorylated states. The rate constants from C1 to O1, from O1 to O2, from C1p to O1p, and from O1p to O2p are Ca2+-dependent; and kphos and kdeph are the phosphorylation and dephosphorylation rates, respectively (see Appendix S1). Panel B: Time course of the relative phosphorylation level of RyRs upon activation of the β1-adrenergic signaling system. Experimental data of Xiao et al. [94] (filled circles) are obtained upon stimulation of rat ventricular myocytes with 1 µM isoproterenol; experimental data of Takasago et al. [95] (filled squares) are obtained from canine ventricular myocytes with endogenous PKA by application of [γ-32P]ATP. Modeling data are obtained by application of 1 µM isoproterenol. Increase in phosphorylation level is determined as a fractional increase related to the maximum increase in phosphorylation of RyRs after activation of the β1-adrenergic signaling system. Panel C: Relative phosphorylation level of RyRs at different concentrations of isoproterenol. Experimental data of Xiao et al. [94] (filled circles) obtained upon stimulation of rat ventricular myocytes for 15 minutes. Simulation data are obtained after 10-minute exposure to different concentrations of isoproterenol. Panel D: Effects of PKA on opening probability of RyRs as function of cytosolic Ca2+ concentration. Experimental data of Xiao et al. [93] are obtained for cardiac RyRs upon application of active (filled circles) and boiled (unfilled circles) PKA at relatively small luminal Ca2+ of 45 nM; experimental data of Xiao et al. [96] (filled squares) for RyRs are obtained from mouse ventricular myocytes. Simulation data for mouse ventricular myocytes in the absence and presence of PKA are obtained at intracellular [Ca2+]i concentration ranged from 0.01 to 10 µM and are shown by dashed and solid lines. Experimental data obtained at small luminal Ca2+ concentration shows larger sensitivity of RyRs to cytosolic Ca2+.

