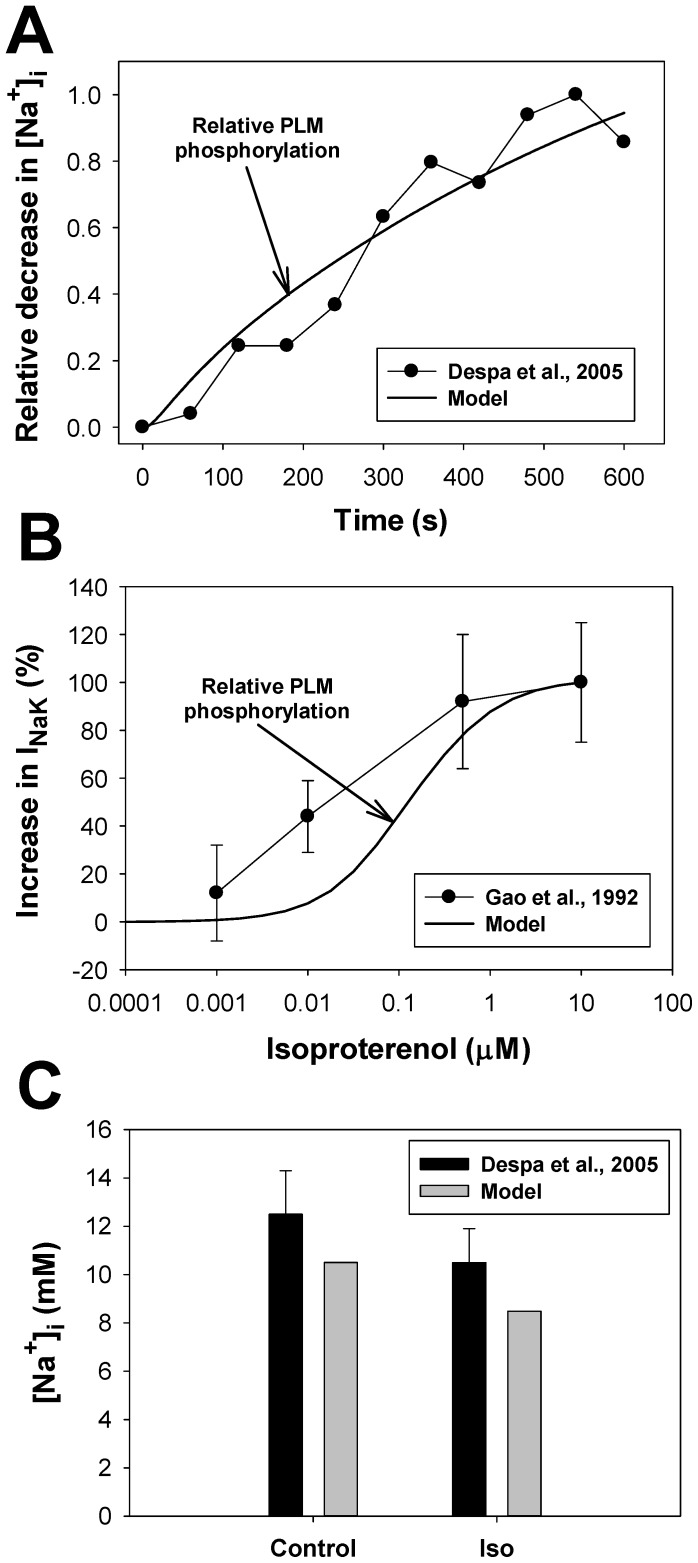
Figure 12. The effects of β1-adrenoceptor stimulation on the Na+-K+ pump.
Panel A: Experimental time course of a relative decrease in the intracellular [Na+]i concentration (filled circles) obtained by Despa et al. [100] from mouse ventricular myocytes after application of 1 µM isoproterenol and corresponding simulated time course of an increase in relative phosphorylation level of phospholemman obtained using our model (solid line). Panel B: Experimental data on a relative increase in INaK current (filled circles) obtained by Gao et al. [101] from guinea pig ventricular myocytes at different concentrations of isoproterenol. Corresponding simulation data with our model on a relative increase in phosphorylation of phospholemman is shown by a solid line. Panel C: Experimental (black bars with errors [100]) and simulated (gray bars) data on intracellular [Na+]i concentration before (control) and after 10-minutes application of 1 µM isoproterenol (Iso).

