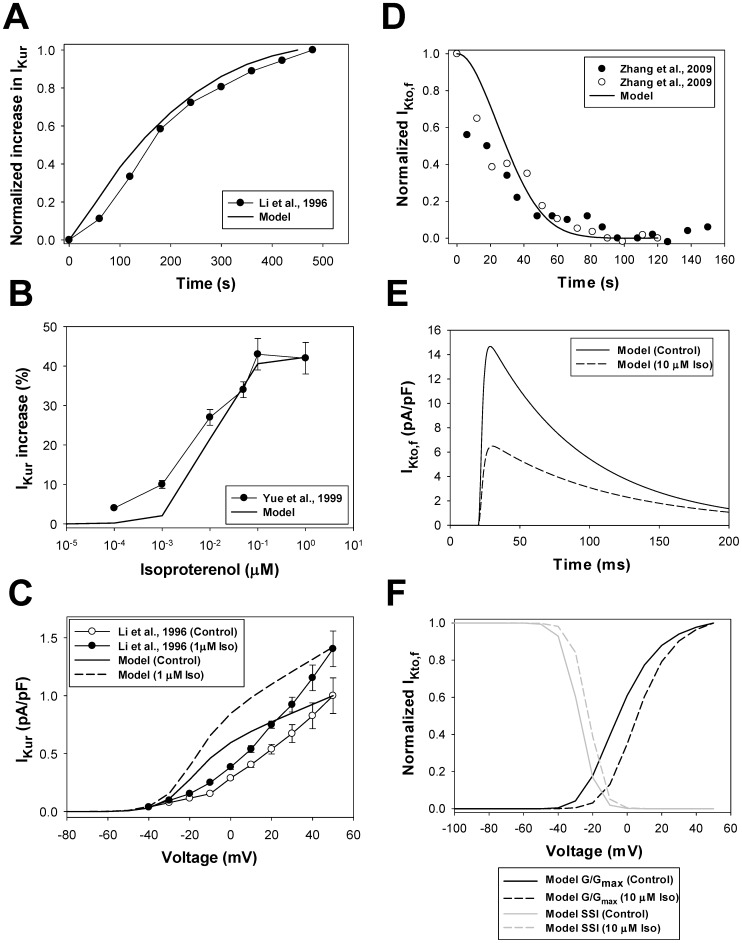
Figure 13. The effects of β1-adrenoceptor stimulation on IKur and IKto,f.
Panel A: Experimental time course of the relative increase in the ultra-rapidly activating delayed-rectifier K+ current IKur obtained by Li et al. [107] from human atrial myocytes after application of 1 µM isoproterenol (line with filled circles) and corresponding simulated time course of an increase in IKur obtained with our model (solid line). Simulation data is obtained with 200-ms pulses from a holding potential of −100 mV to +40 mV at stimulation frequency 0.02 Hz. Panel B: Experimental data on a relative increase in IKur current (filled circles) obtained by Yue et al. [108] from canine atrial myocytes at different concentrations of isoproterenol. Corresponding simulation data with our model on relative increase in IKur are shown by a solid line. Simulation data is obtained with 4.5-s pulses from a holding potential of −90 mV to 0 mV after 800-s exposure to different concentrations of isoproterenol. Panel C: Experimental (human atrial myocytes [107], solid lines with circles) and simulated (solid and dashed lines) data on current-voltage relationships for IKur current. Experimental data for control conditions and those obtained after application of 1 µM isoproterenol are shown by unfilled and filled circles, respectively. Simulated data for control conditions are shown by a solid line, and 1 µM isoproterenol simulations are shown by a dashed line. Simulated currents are obtained by 4.5-s depolarizing pulses to between −80 and +50 mV (in 10-mV increment) from a holding potential of −90 mV. Panel D: Experimental time course of the relative decrease in the rapidly recovering transient outward K+ current IKto,f obtained by Zhang et al. [111] from mouse Schwann cells after application of 1 µM forskolin (filled circles) or 10 µM db-cAMP (unfilled circles), and corresponding simulated time course of a relative decrease in IKto,f phosphorylation obtained with our model after stimulation with 10 µM isoproterenol (solid line). Panel E: Simulated time course of IKto,f traces obtained by depolarization pulses to −5 mV from a holding potential of −100 mV for control (solid line) and after stimulation with 10 µM isoproterenol (dashed line). Panel F: Simulated data for G/Gmax (black lines) and steady-state inactivation relationships (gray lines) obtained for IKto,f with two-pulse protocol (P1 stimuli from −100 to +50 mV in 10 mV intervals for 500 ms, following P2 pulse to +50 mV for 500 ms; holding potential is −100 mV) in control (solid lines) and after application of 10 µM isoproterenol (dashed lines).

