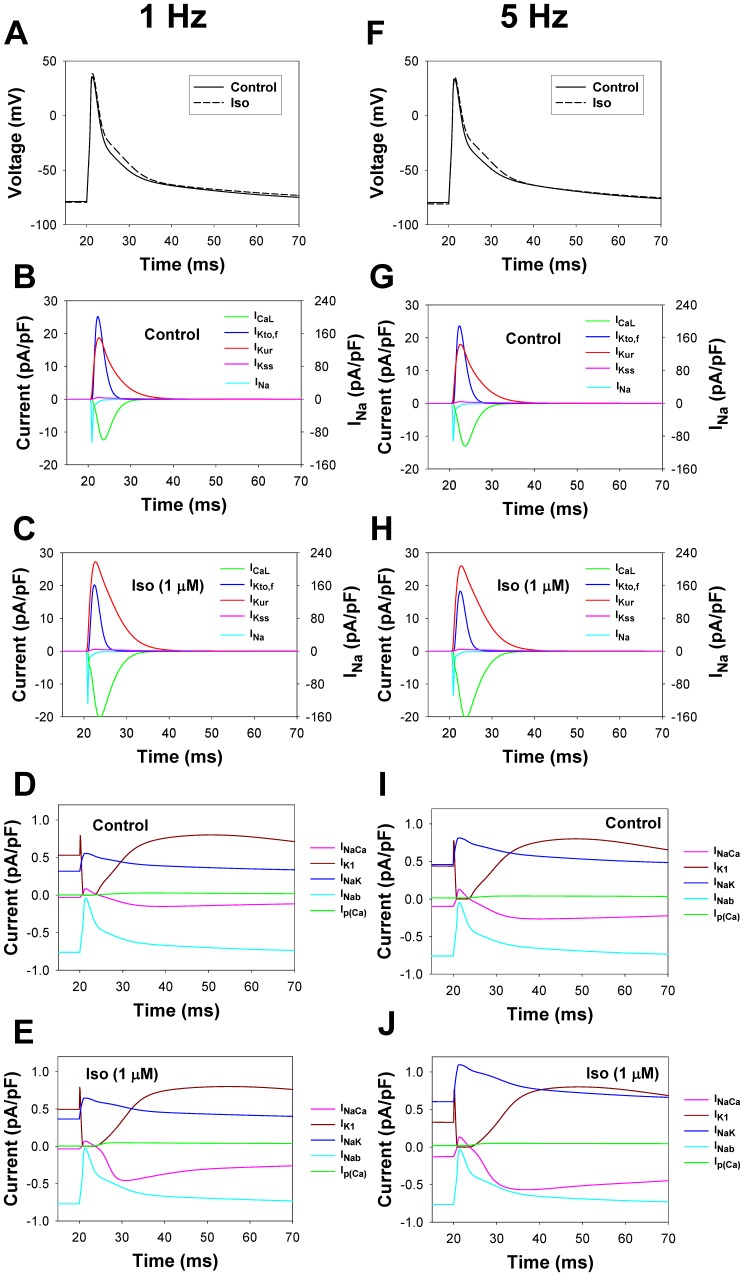
Figure 17. Simulated action potentials and underlying ionic currents of the isolated ventricular cell model.
Simulated action potentials and underlying ionic currents are shown for control conditions and after application of 1 µM isoproterenol at two pacing frequencies 1 Hz (Panels A–E) and 5 Hz (Panels F–J) (Istim = 80 pA/pF, τstim = 1.0 ms). Panels A and F: Simulated action potentials for control conditions (solid line) and after isoproterenol application (dashed line). Panels B, D, G, and I: Currents underlying the AP for control condition. Panel C, E, H, and J: Currents underlying the AP after isoproterenol application. The scales for the relatively large fast Na+ current, INa, are given on the right axis in Panels B, C, G and H. APs and ionic currents are shown after 300 s stimulation. In Panels A, C, E, F, H, and J 1 µM isoproterenol is applied at time t = 0 s.

