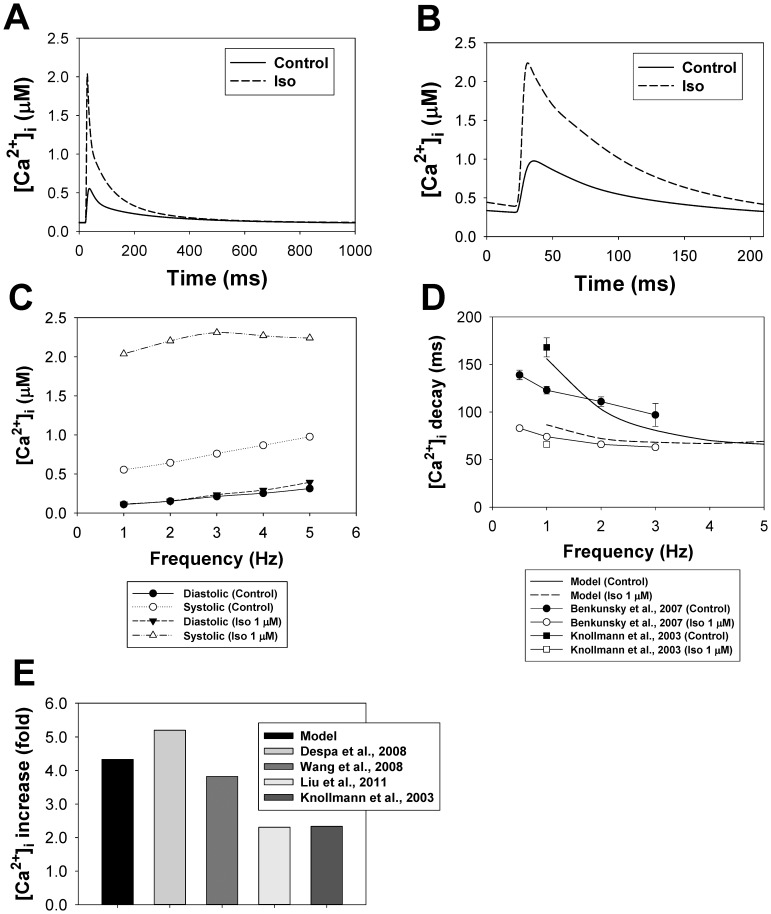
Figure 18. Simulated and experimental [Ca2+]i transients and their characteristics in an isolated ventricular cell for control conditions and after application of isoproterenol.
Panel A: Simulated [Ca2+]i transients for control conditions (solid line) and after 1 µM isoproterenol application (dashed line) obtained with 1 Hz-stimulation. Panel B: Simulated [Ca2+]i transients for control conditions (solid line) and after 1 µM isoproterenol application (dashed line) obtained with 5 Hz-stimulation. Panel C: Simulated diastolic (filled symbols) and systolic (unfilled symbols) [Ca2+]i magnitudes for control conditions (circles) and after 1 µM isoproterenol application (triangles) as functions of stimulation frequency. Panel D: Decay time constants for intracellular [Ca2+]i transients for control conditions and after 1 µM isoproterenol application as functions of stimulation frequency. Simulated data are shown by solid (control) and dashed (1 µM isoproterenol) lines. The lines with symbols show experimental data from Benkunsky et al. [131]; experimental data from Knollmann et al. [128] are shown by squares. Panel E: Increase in [Ca2+]i transient amplitudes after application of isoproterenol (folds). Model data and data of Wang et al. [75] and Liu et al. [129] are obtained at 1 Hz and 1 µM isoproterenol; data of Despa et al. [127] are obtained at 2 Hz and 1 µM isoproterenol; data of Knollmann et al. [128] are obtained at 1 Hz and 0.5 µM isoproterenol. All simulation data in this figure are obtained after 300-s stimulations and exposure to 1 µM isoproterenol.

