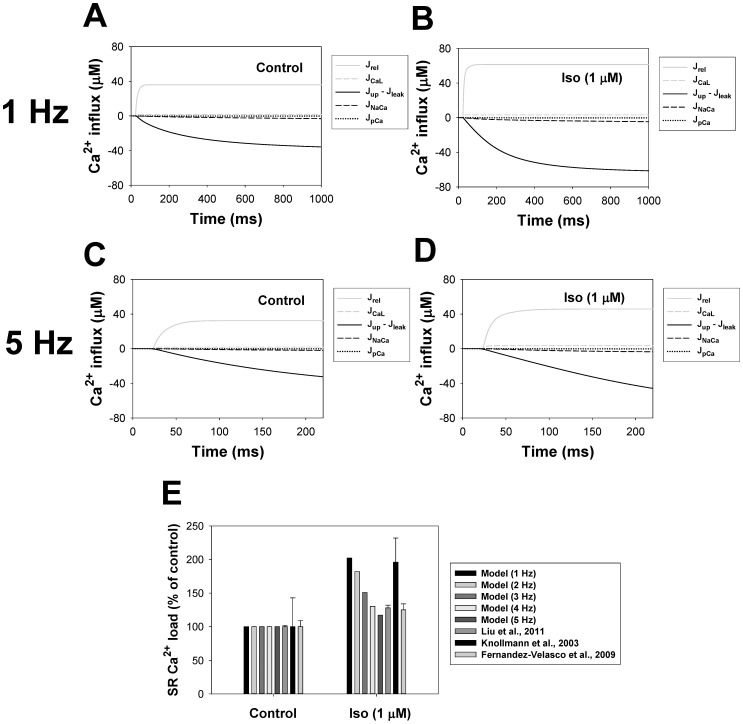
Figure 19. Ca2+ fluxes and the SR Ca2+ load.
Simulated major integral Ca2+ fluxes during one cardiac cycle in the isolated ventricular cell model for control conditions (Panels A and C) and after application of 1 µM isoproterenol (Panels B and D). Pacing frequencies are 1 Hz (Panels A and B) and 5 Hz (Panels C and D). Major integral Ca2+ fluxes are shown after 300 s of stimulation. In Panels B and D 1 µM isoproterenol is applied at time t = 0 s. Here, JCaL is the Ca2+ entering the cell through L-type Ca2+ channels; Jup – Jleak is the uptake Ca2+ from the cytosol to the network SR with subtracted Ca2+ leak from the SR to the cytosol; JNaCa is the Ca2+ outflux from the cytosol through the Na+/Ca2+ exchanger; and JpCa is the Ca2+ outflux through the sarcolemmal Ca2+ pump. Panel E: Increase in the SR Ca2+ load after 300-s application of isoproterenol. Model data are shown for stimulation frequencies 1, 2, 3, 4, and 5 Hz; experimental data of Liu et al. [129] and Fernandez-Velasco et al. [132] are obtained at 1 µM isoproterenol; data of Knollmann et al. [128] are obtained at 0.5 µM isoproterenol.

