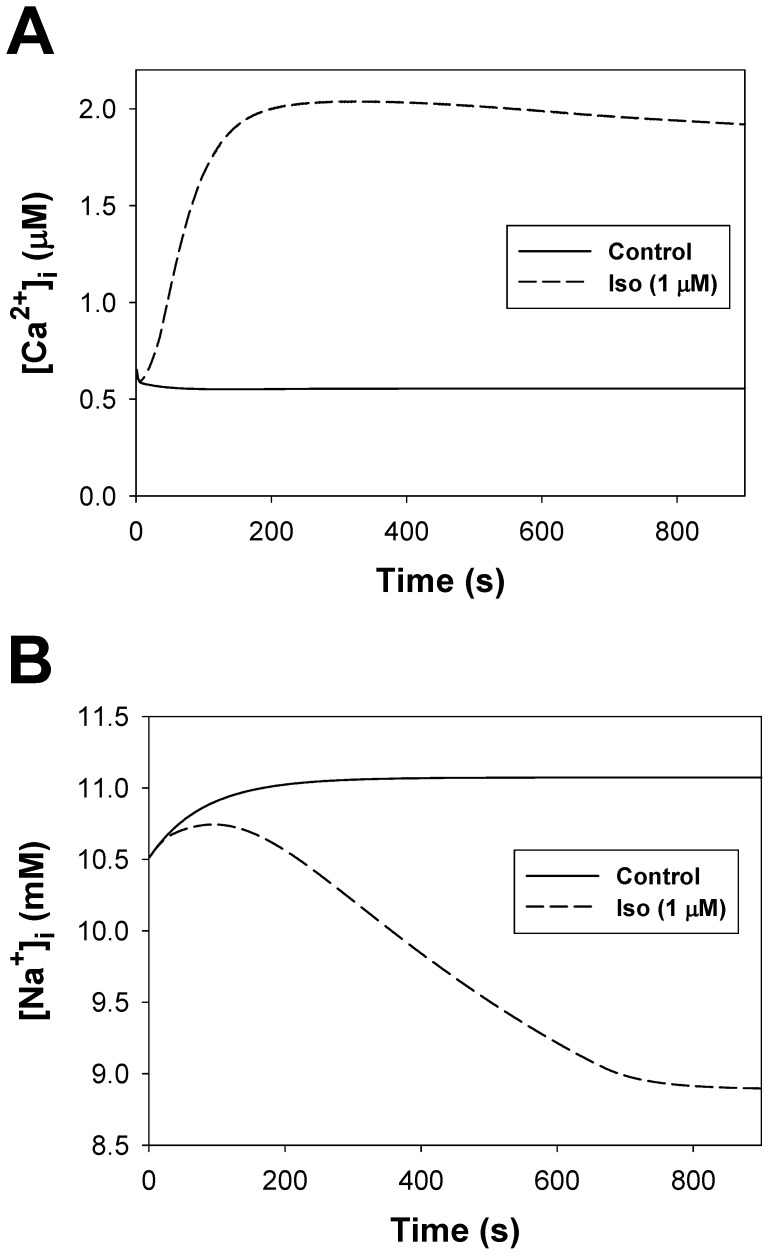
Figure 20. Dynamics of [Ca2+]i transients and [Na+]i concentrations upon stimulation of β1-adrenoceptors.
Panel A: Simulated peak values of [Ca2+]i transient as function of time for control conditions (solid line) and after 1 µM isoproterenol application at t = 0 s (dashed line). Panel B: Simulated intracellular [Na+]i concentrations as function of time for control conditions (solid line) and after 1 µM isoproterenol application at t = 0 s (dashed line). In both panels, stimulation frequency is 1 Hz.

