
Figure 3. Topologies of band power differences between initiation and non-initiation states.
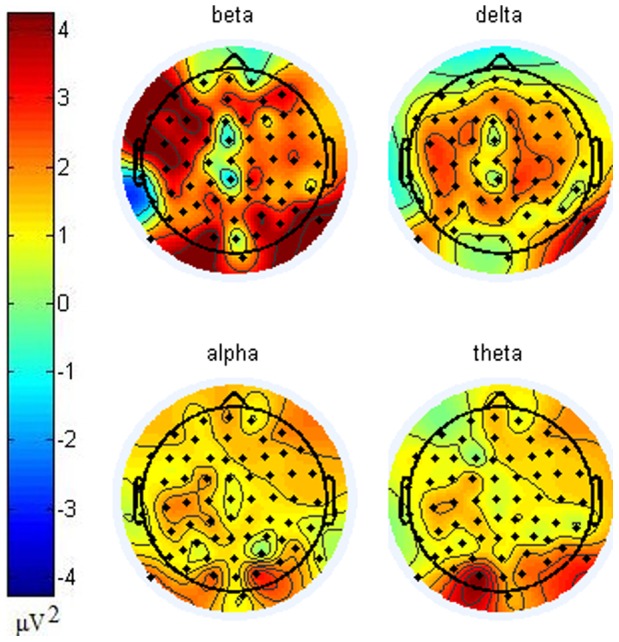
Power differences were calculated by subtracting powers in non-initiation state from initiation state in each frequency band in each electrode. Beta band powers from various clusters were observed to be higher in initiation state than in non-initiation state. While larger delta band power differences occurred in the back of frontal, motor and front of parietal clusters. Band powers in occipital lobe for alpha and theta bands were higher in initiation state.