
Figure 4. Prediction accuracy averaged across all subjects using band power in the delta, theta, alpha and beta frequency bands.
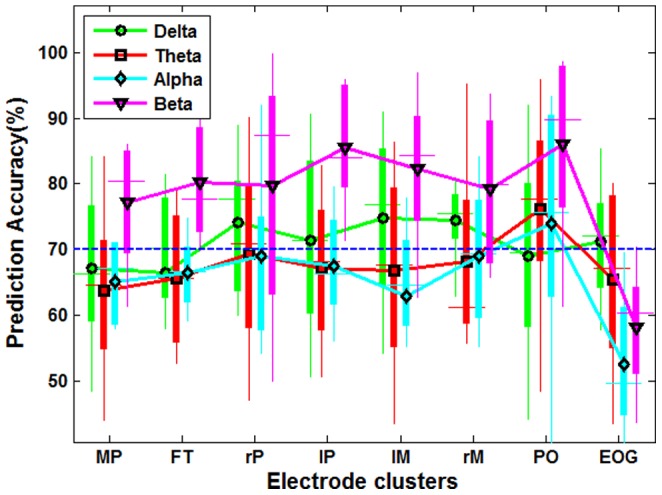
The lower and upper edges of each box are the 25th and 75th percentiles of prediction accuracy, while lower and upper whiskers represent the worst and best accuracy. The black symbol in each box is the average prediction accuracy across all subjects. MR, FT, rP, lP, lM, rM, PO and EOG represent medial regions, frontal, right-parietal, left-parietal, left-motor, right-motor, parietal-occipital and the EOG cluster respectively.