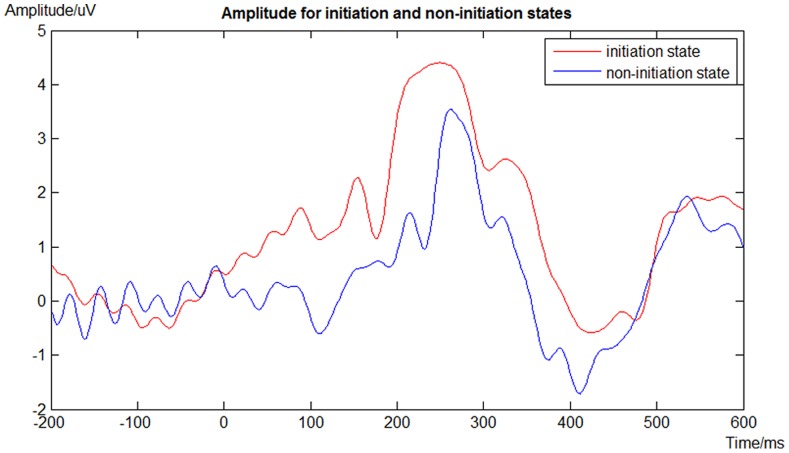
Figure 6. Time domain amplitude in [−200 600]ms respect to stimulus onset for initiation and non-initiation states.
A sample EEG waveform average across trials from left parietal cluster (CP3, CP5, P3, P5, P7, TP7) for one representative subject was shown, in which P300 potential could be observed in both states. The appearance of two natural images generates higher P300 response compared to the condition with one blue square. Blue line represents the averaged amplitude in non-initiation state; red line represents the averaged amplitude in initiation state.

