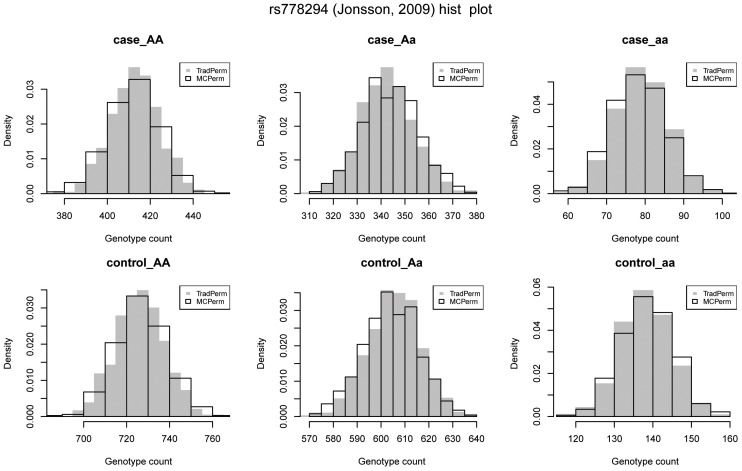
Figure 3. Distributions of the six genotype counts.
AA, Aa, aa in cases, and AA, Aa, and aa in controls. Gray solid bars represent the distributions obtained under TradPerm, and black hollow bars represent the distributions generated by MCPerm. The distributions are the same between MCPerm and TradPerm.

