
Figure 3. PCA for the CIGs on the breast cancer cell line data sets.
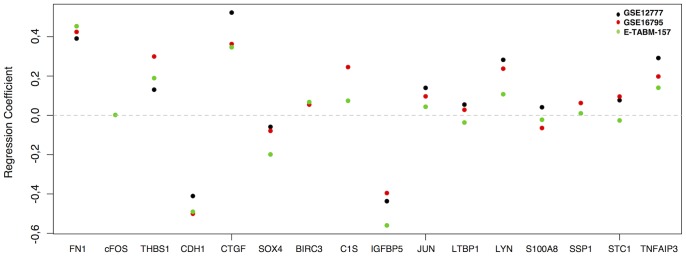
Regression coefficients for the first principal components obtained by performing PCA for the CIGs on the breast cancer cell line data sets. The X-axis represents the 16 CIGs, the Y-axis represents the regression coefficients. The black, red and green dots are indicative for respectively GSE12777, GSE16795 and E-TABM-157. Positive and negative regression coefficients indicate respectively pro-invasive and contra-invasive genes. The magnitude of the regression coefficient reflects the importance of the corresponding gene in determining the CIG expression. The horizontal dashed line indicates a regression coefficient of zero. Some genes are represented less than 3 times due to the fact that not all CIG were amongst the informative gene list in every cell line data set. Most of the CIGs, except for S100A8, STC1 and LTBP1 show consistent regression coefficients indicating that they have a similar behaviour with respect to the prediction of the invasiveness phenotype of breast cancer cells in all 3 data sets.