
Fig. 3.
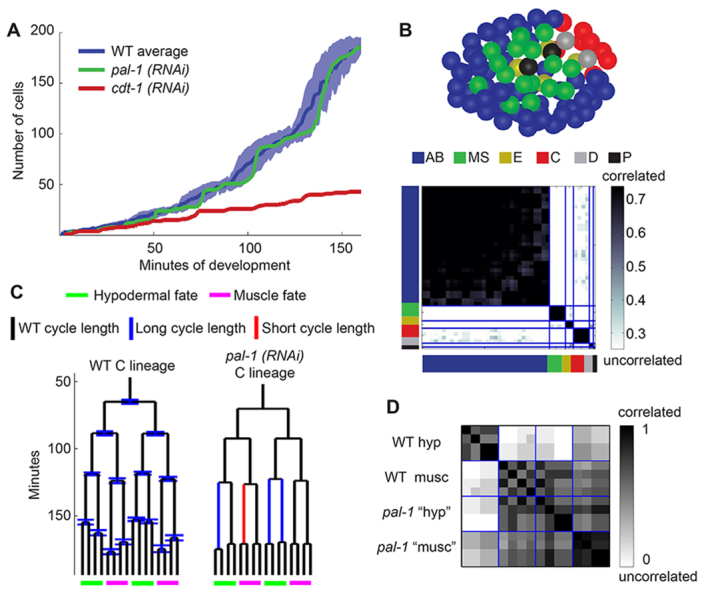
Analyzing proliferation at multiple scales can uncover a variety of phenotypes. (A) The number of cells in the embryo over time reflects the global proliferation rate. Blue represents the wild-type average plus and minus one standard deviation. Green and red each represent an RNAi-treated embryo. (B) (Top) The spatial distribution of cells that divide synchronously. Each synchronous group is marked by a different color. These groups correspond perfectly with lineage groups. The embryo is at the start of the AB64 stage, viewed ventrally. (Bottom) A heat map showing the degree of correlation between cells. The colors along the axes represent the lineage groups as in the top panel. Division timing is correlated within lineage groups, but not between them. (C) Wild-type average cell cycle lengths and standard deviations in the C lineage, and pal-1(RNAi) cell cycle lengths highlighting statistically significant deviations (P<0.01). (D) Correlation of the division timing histories of the C lineage in a wild-type embryo and pal-1(RNAi) embryo. The wild-type lineage forms two groups separated by cell fates, whereas all of the pal-1(RNAi) cells are correlated with the wild-type muscle division timing. hyp, hypodermal; musc, muscle.