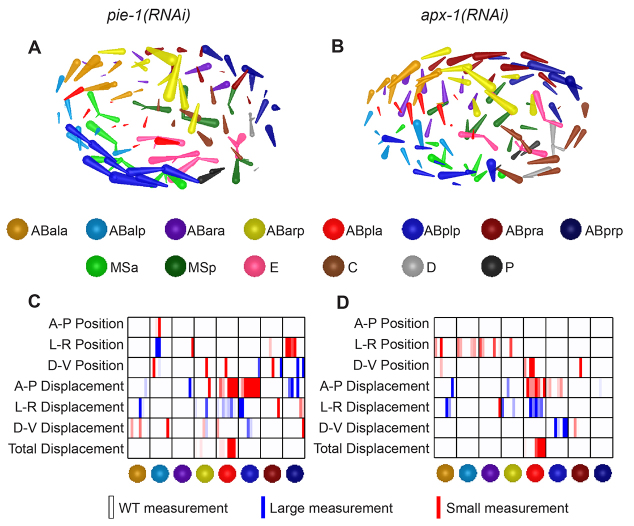
Fig. 6.
Collective migration patterns emerge in RNAi treatments. (A,B) Each rod represents a cell’s displacement over a 15-minute period. (A) In an embryo treated with pie-1(RNAi), cells at the posterior and anterior extremes of the embryo migrate from left to right and meet at on the embryo’s right side. (B) An apx-1(RNAi) embryo shows cells producing a similar pattern to those in A. (C,D) The P-value chart for cell positions and movements in A (C) and in B (D). Measurements with P<0.01 are in red or blue. A-P, anterior-posterior; L-R, left-right; D-V, dorsal-ventral.

