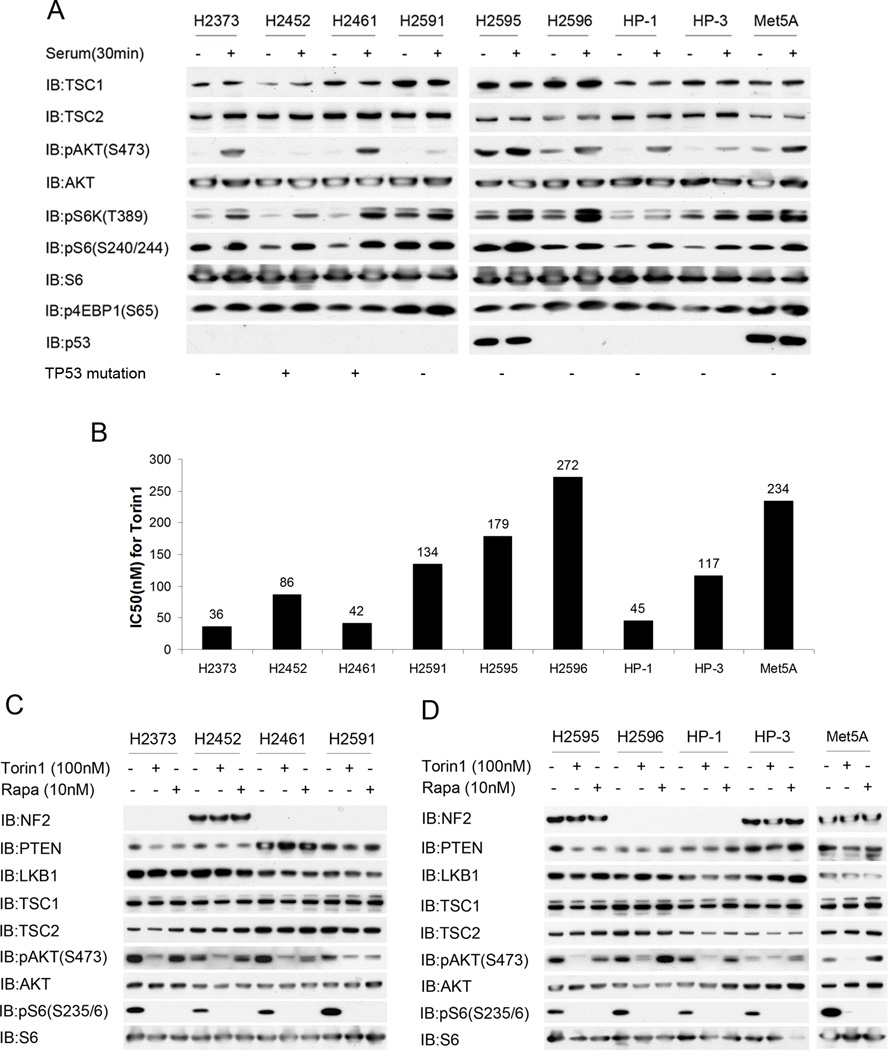
Figure 6. AKT and mTORC1 activation, and response to Torin1 in human mesothelioma cell lines.
A. Immunoblot analysis of human mesothelioma cell lines after 48 h of serum starvation (−) or 30 min after serum addback following serum starvation (+), for multiple components of the AKT-mTOR signaling pathway. Note high pS6K(T389), pS6(S240/244), and p4EBP1(S65) levels in serum starvation conditions for lines H2591, H2595, H2596, and Met5A. Presence or absence of mutation in TP53 as assessed by PCR sequencing of exons 5 to 9 is shown at bottom. H2452 had c.817delCGTGTTTG, and H2461 had c.C817T, p.R273C.
B. IC50 concentration of mTOR inhibitor Torin1 for 9 human mesothelioma cell lines.
C–D. Immunoblot analysis of human mesothelioma cell lines following treatment with mTOR inhibitors 10nM Rapamycin or 100nM Torin1 for 24 h. Note reduction in pAKT(S473) in all lines when treated with Torin1; and absence of NF2 in 5 of the lines.

