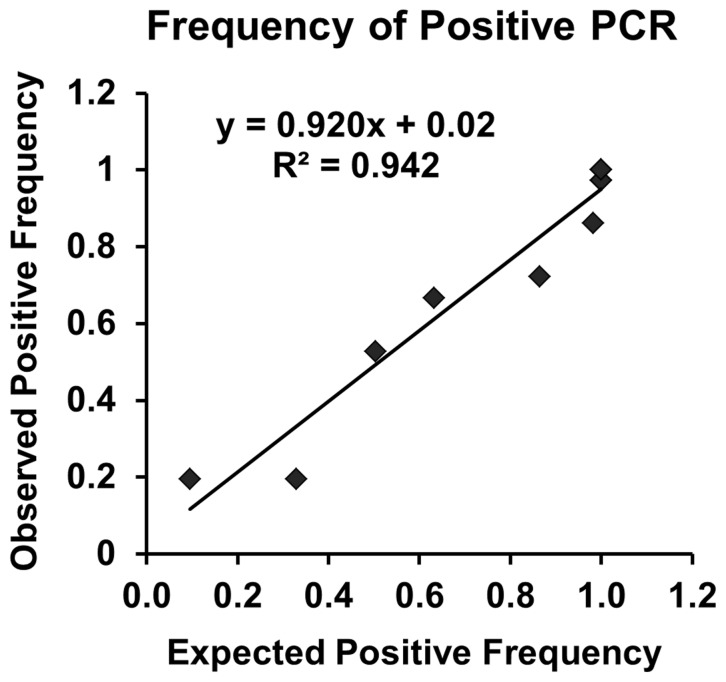
Figure 2. Observed compared to expected positive PCR with limiting dilution.
Frequency of observed relative to expected positive PCR signal was measured. Poisson analysis was used to calculate expected positive frequency. Results from the average of nine replicates at each of 10 internal standard mixture dilution points (40, 20, 10, 7, 4, 2, 1, 0.7, 0.4, 0.1 molecules/µl) averaged across the four genes (ACTB, MYC, E2F1, CDKN1A) were compiled and plotted. Each gene plot is presented in Figure S2 in File S1.

