
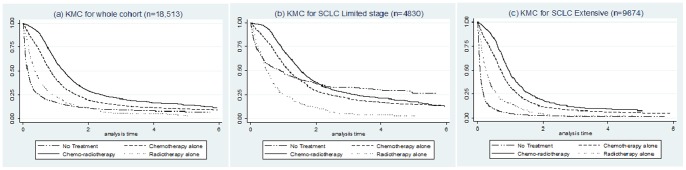
Figure 1. Kaplan-Meier curve estimates adjusted for age, sex, PS and co-morbidity by treatments received: (a) for whole cohort, (b) for SCLC limited and (c) for SCLC Extensive.
Official websites use .gov
A
.gov website belongs to an official
government organization in the United States.
Secure .gov websites use HTTPS
A lock (
) or https:// means you've safely
connected to the .gov website. Share sensitive
information only on official, secure websites.