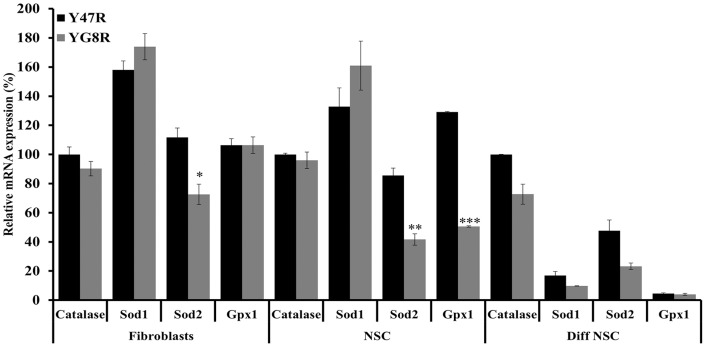
Figure 9. Antioxidant gene expression analysis.
Catalase, Sod1, Sod2 and Gpx1 gene expression levels were determined in all three Y47R and YG8R cell types by qRT-PCR. Values were expressed relative to the levels of both Gapdh and β2M and in each case all gene expression levels were normalized to the mean expression levels of the Catalase gene of Y47R cells set at 100%. Two individual cDNA samples were analyzed for each cell type and each reaction was carried out in triplicate. Error bars represent s.e.m (*p<0.05, **p<0.01, ***0.001).

