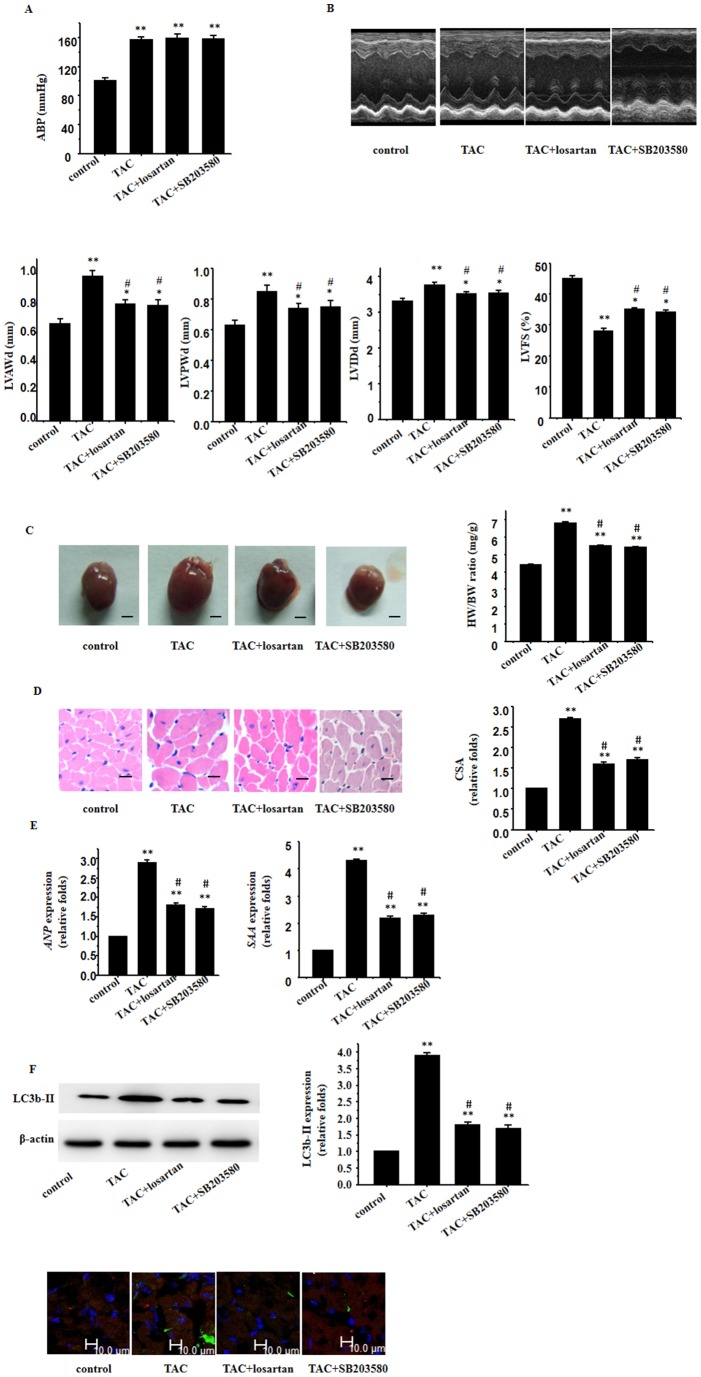
Figure 4. Involvement of cardiomyocyte autophagy in pressure overload-induced cardiac hypertrophy and dysfunction.
A: BP recordings; Representative recording was shown from 5 mice; B: Echocardiographic analysis with representative M-mode tracings from 5 mice. All echocardiograghic data are shown as mean ± S.E.M from 5 mice; LVAWd, LV anterior wall thickness at end-diastole; LVPWd, LV posterior wall thickness at end-diastole; LVIDd, LV internal dimension at end-diastole; LVFS, LV fraction shortening; C: Heart morphology and weight; representative global heart photographs of 5 mice (scale bar: 2 mm); heart weigh to body weight radio (HW/BW) measured from 5 mice; D: H-E stained LV sections of mice; scale bar: 20 µm; cross sectional area (CSA) of cardiomyocyte measured from 5 sections for one heart and 5 hearts examined; E: expression of Anp and Saa genes evaluated by the real time RT-PCR. β-Actin used as internal control; F: Western blot analyses and immunofluorescent staining for expression of LC3b-II proteins using an anti LC3b-II antibody (green); β-actin in whole cell lysate used as the loading control; the hearts also subjected to the immunofluorescent staining for α-MHC (red) and DAPI staining; representative photograms from 5 hearts are shown. All values are expressed as mean ± S.E.M. of 5 mice in all groups; * p<0.05, ** p<0.01 vs. control; # p<0.05, ## p<0.01 vs. TAC-treated group.

