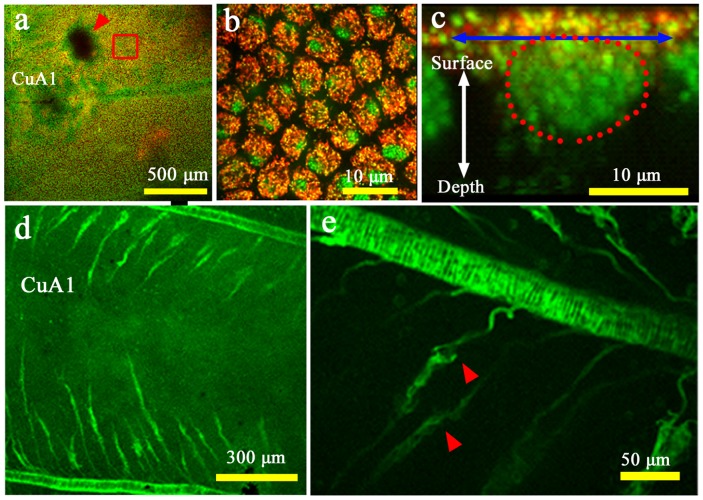
Figure 6. Fluorescent images of epithelial cells and tracheal branches.
(a) Low-magnification image of compartments CuA1 and M3 stained with MitoTracker Orange for mitochondria (in red) and SYBR Green-1 for nuclei (in green), immediately after pupation. The red arrowhead indicates the organizing center for the border symmetry system, which is resistant to staining. This non-stained black area was not detected in the adjacent compartment where no eyespot exists in adult wings. Also see Figure 5a. The boxed region is magnified in (b). (b) High-magnification image of the epithelial cells boxed in (a). Yellow dots indicate mitochondrial DNA. (c) Optical cross section of the stained epithelial cells. The diameter of a single cell is indicated by a double-headed arrow. Cellular nucleus is encircled by red dots. Note the mitochondrial distribution on the dorsal surface of the cell. Yellow regions indicate mitochondrial DNA. (d, e) Compartment CuA1 stained with DiBAC4(3). Tracheae are stained well, and the epithelial cells are weakly stained. A portion of a tracheal knob is indicated by red arrowheads to demonstrate its vigorous movement.

