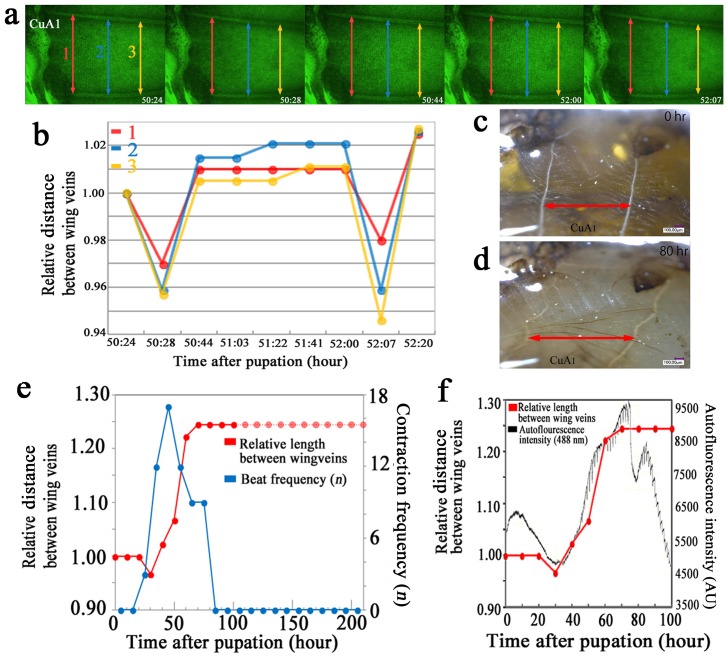
Figure 8. Distance changes associated with the wing-tissue contraction pulses and autofluorescence intensity.
(a) Three distance measurements (red, blue, and yellow double-headed arrows, designated 1, 2, and 3, respectively) between the two veins that define compartment CuA1. The postpupation time is also indicated. All panels are shown at the same magnification. These are static images from Movie S3. (b) Changes in length (distance) between the two wing veins over time. The measured distances are indicated in (a). These measurements were conducted using Movie S3. (c, d) Images of the distances between the wing veins at 0 h and 80 h postpupation in compartment CuA1. These panels are at the same magnification, showing static images from Movie S6. These images of the wing of a physically fixed pupa were taken at the same position at different time points, and the distances were measured between the two points despite the tilting of the wing veins relative to the double-headed red arrows as the wing grows. (e) Relative distance between the wing veins in compartment CuA1, as shown in (c, d) (indicated with red dots and lines), and the contraction frequency (shown in blue dots and lines). The distance at 0 h was considered to be 1.00, and other values were normalized accordingly. The broken lines indicate difficulty in measuring the distance, but no change appeared to occur afterwards. Note that an increase of the contraction frequency is followed by an increase in this distance in the early phase, and a decrease of the beat frequency is followed by the distance plateauing. These measurements were conducted using images from Movie S6. (f) The relative distance between the wing veins, as shown in (e) (measured from Movie S6), and the autofluorescence intensity (measured from Movie S3). The autofluorescence intensity increases together with the relative length between the wing veins.

