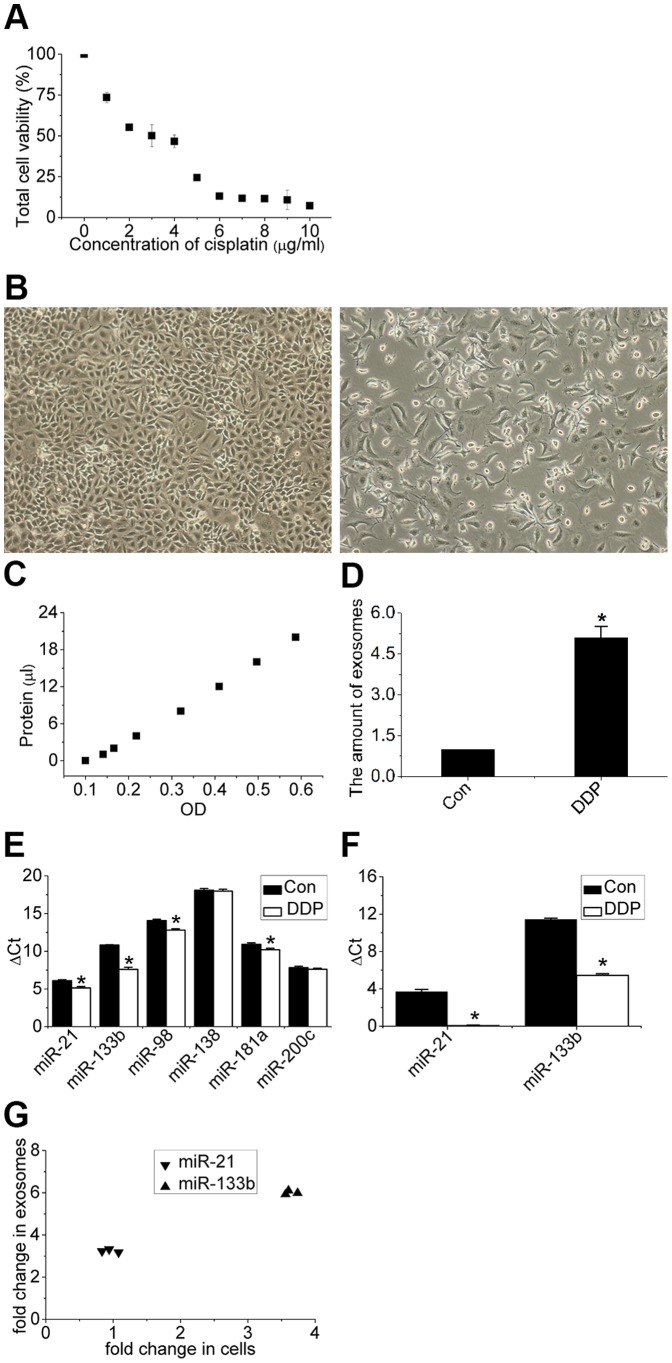
Figure 2. Response of A549 cells to cisplatin.
(A) Dose response relationship between viability of A549 cells (%) and concentration of cisplatin (1–10 µg/mL) for 48 h. (B) Microscopic image of A549 cells treated with 0 and 3 µg/mL cisplatin. Images were obtained at a magnification of 100×. (C, D) Quantity of exosomes determined via the BCA standard curve and enhanced secretion of exosomes normalized to cell numbers after exposure of A549 cells to cisplatin. (E) Differential expression levels of the six miRNAs in cells after exposure of A549 cells to cisplatin. (F) Differential expression levels of the two miRNAs in exosomes after exposure of A549 cells to cisplatin. (G) Fold-changes in expression of miR-21 and miR-133b in exosomes are higher than those in cells. Bars indicate mean ± SD of three replicates. *indicates p<0.05 versus control groups.

