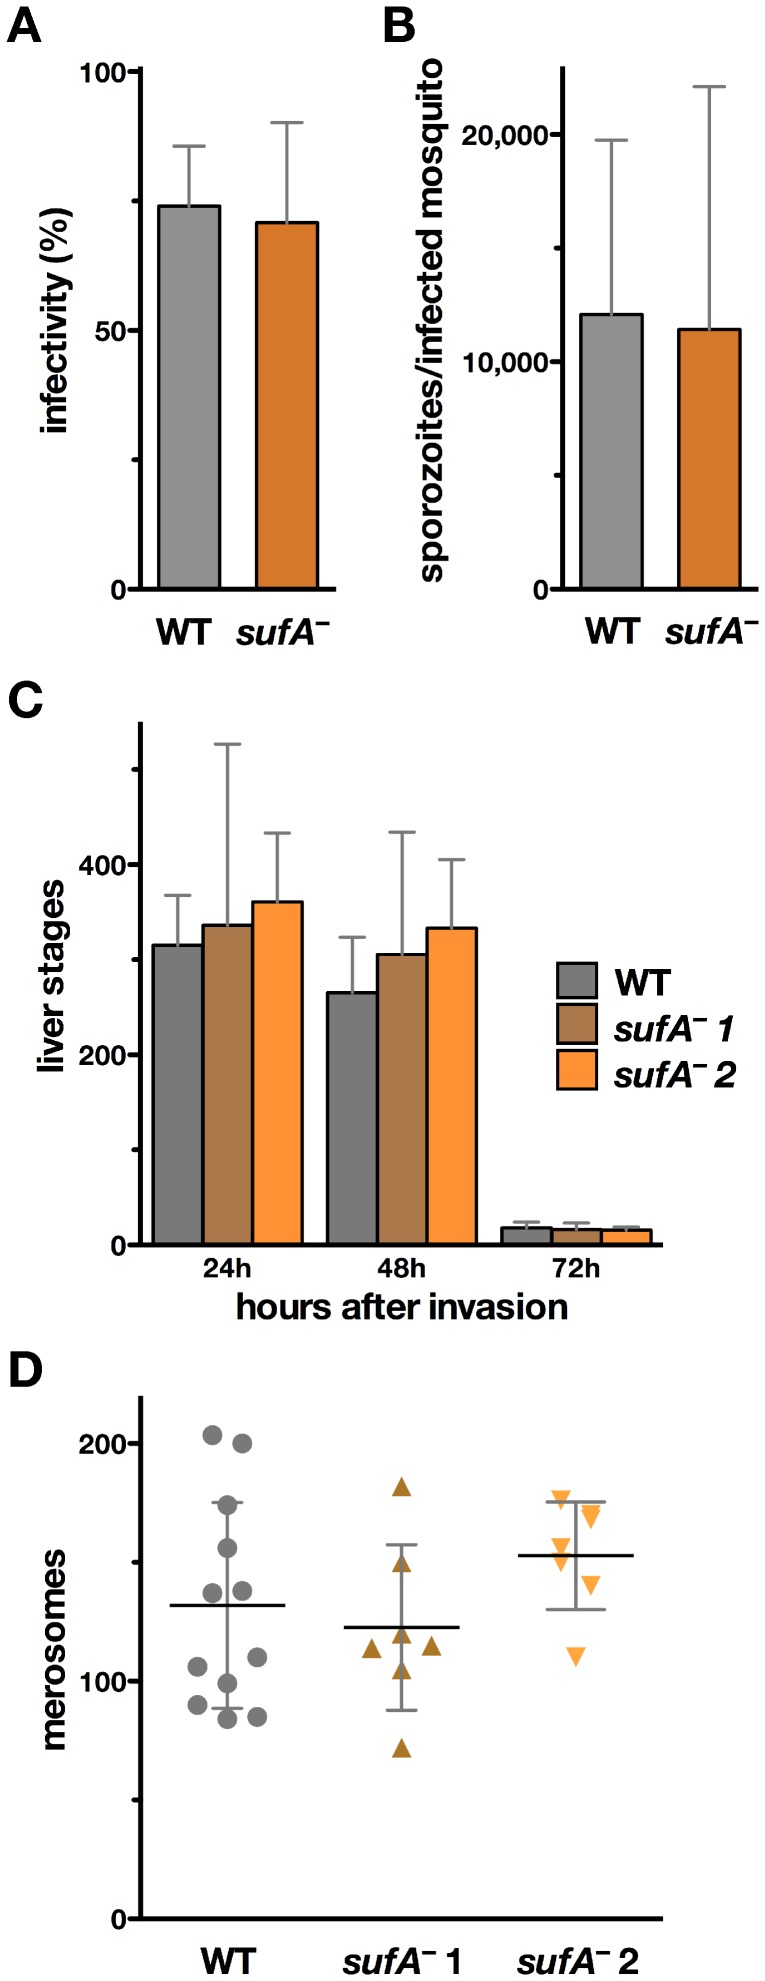
Figure 3. Normal development of sufA – parasites in the mosquito vector and during liver cell infection.
(A) Percentage of A. stephensi mosquitoes infected with WT (gray, n = 4) and sufA – (brown, n = 6) parasites. Shown is the mean percentage (± S.D.) from independent mosquito feeding experiments. For sufA – infections, both isogenic strains, sufA –1 (n = 4) and sufA –2 (n = 2), were transmitted to mosquitoes and data combined. (B) Mean sporozoite number (± S.D.) in salivary glands (days 17–21 after infection) from the same independent mosquito feedings as shown in panel A (WT, n = 4; pooled sufA –, n = 6). (C) Liver stages development of WT and sufA – parasites in cultured hepatoma cells. Shown are mean numbers (± S.D.) of intracellular parasites at the time points indicated from two experiments done in quadruplicate each. (D) Merosome formation at 72 h after infection. Shown are mean values (± S.D.). None of the sufA – data points were significantly different from the corresponding WT values (P>0.05; non-parametric, two-tailed Mann-Whitney’s test).

