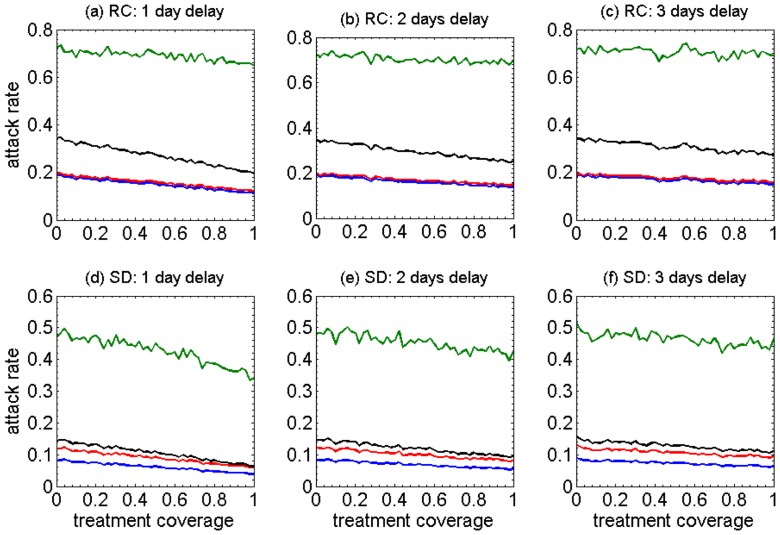
Figure 2. The impact of different coverages (0–100%) of antiviral treatment on the age-specific relative attack rates under different assumptions for the mean time between symptoms onset and the start of treatment (1–3 day delay).
Panels a–c (RC) show results from the model representing the remote and isolated Canadian Aboriginal community, and panels d–f (SD) show results from the model representing a community with an urban-like shifted demographic structure. Green: School-aged children (6–18); red: adults (19–49); blue: older adults (50+); black: pre-school (0–5).

