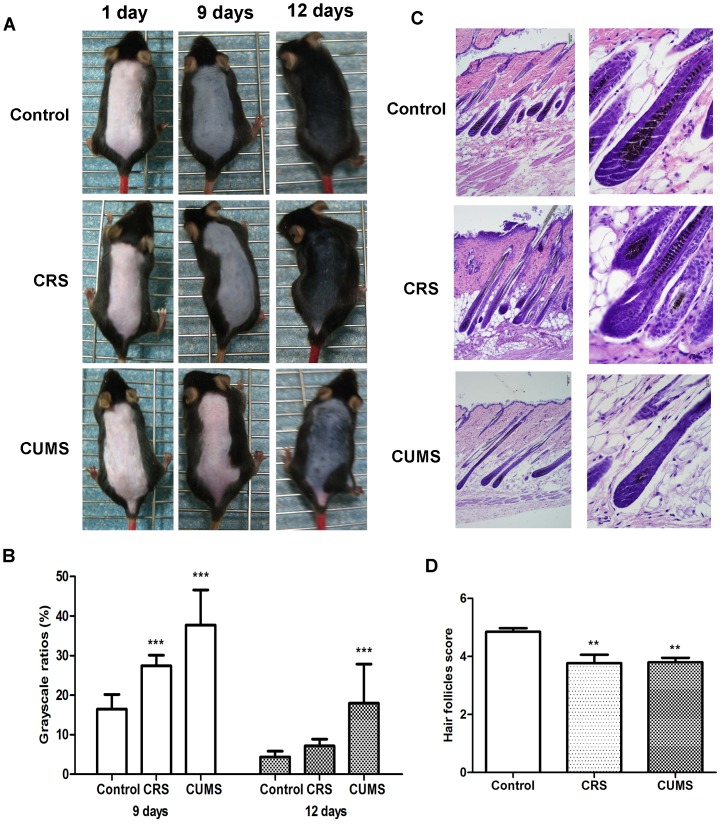
Figure 1. Macroscopic observations of the pigmentary response and the hair cycle stage after stress.
A: The significant area of color in the dorsal skin was from neck to tail. B: The corresponding skin color gray-scale ratio on day 9 was shown on the left and day 12 on the right. C: A representative area of each group on day 12 after depilation with the majority of hair follicles. Original magnification was ×100 on the left and ×400 on the right. D: The results of hair follicles score for day 9 were shown on the left and the data for day 12 on the right. For each mouse a minimum of 6 individual visual fields were assigned to define hair cycle stages. Data are presented as mean ± SD, n = 15 in each group, *P<0.05, **P<0.01 and ***P<0.001 vs control group.

