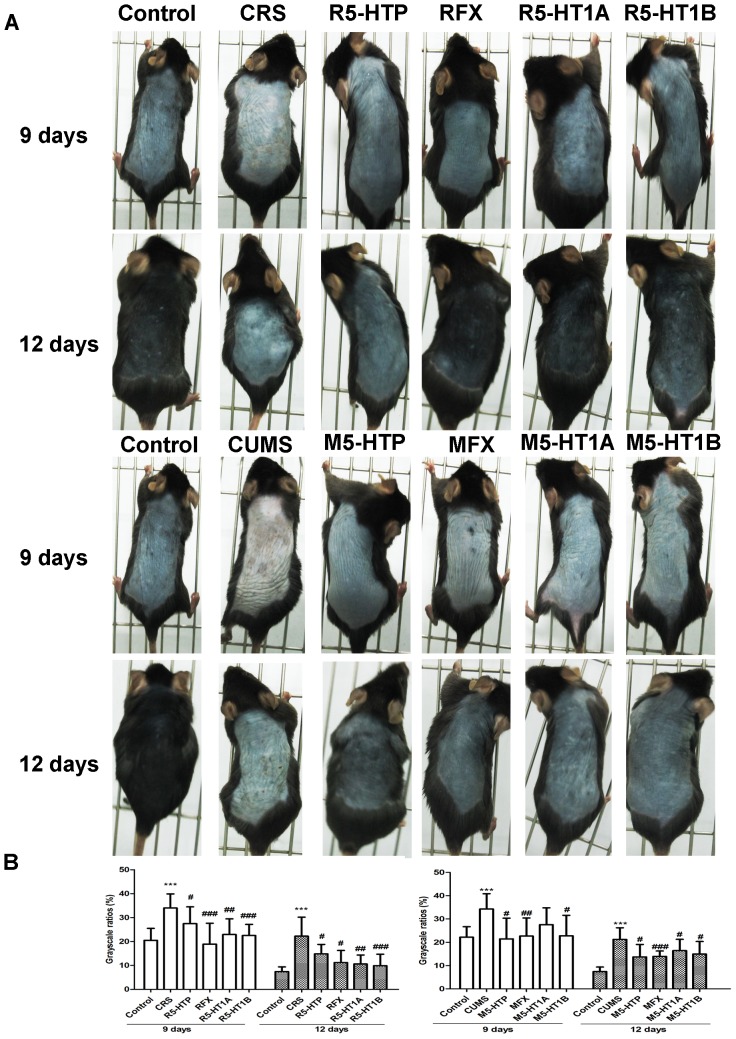
Figure 8. Macroscopic observations of the pigmentary response by administration of 5-HTP, FX and 5-HT1A/1B agonists to stressed mice.
A: The significant area of color in the dorsal skin was from neck to tail. B: The corresponding skin color gray-scale ratio on day 9 and day 12 was shown. Data are presented as mean ± SD, n = 10 in each group, ***P<0.001 vs control group, #p<0.05 vs CRS or CUMS group, ##p<0.01 vs CRS or CUMS, ###p<0.001 vs CRS or CUMS group.

