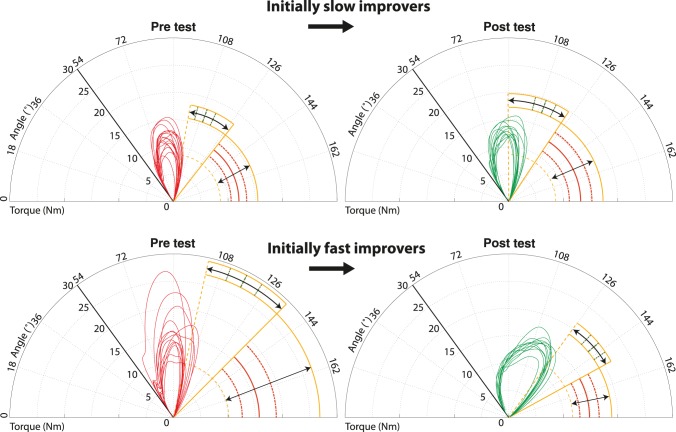
Figure 6. The first and last trial of a typical participant for both groups.
The push-curves of the torque against the angle show the intra-individual variation in contact angle and maximum torque within a trial. The change over time because of practice is shown by the push-curves over time between the pre and posttest. Since no position data were recorded each push is started from the same arbitrary angle.

