
Figure 2. Survival curves of patients based on their pre-treatment serum ferritin levels.
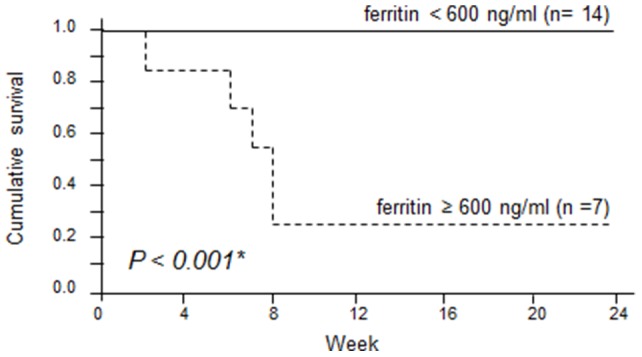
Survival rates were calculated by the Kaplan-Meier test and compared by log-rank test. (solid line: <600 ng/ml; dashed line: ≥600 ng/ml).
Official websites use .gov
A
.gov website belongs to an official
government organization in the United States.
Secure .gov websites use HTTPS
A lock (
) or https:// means you've safely
connected to the .gov website. Share sensitive
information only on official, secure websites.
Survival rates were calculated by the Kaplan-Meier test and compared by log-rank test. (solid line: <600 ng/ml; dashed line: ≥600 ng/ml).