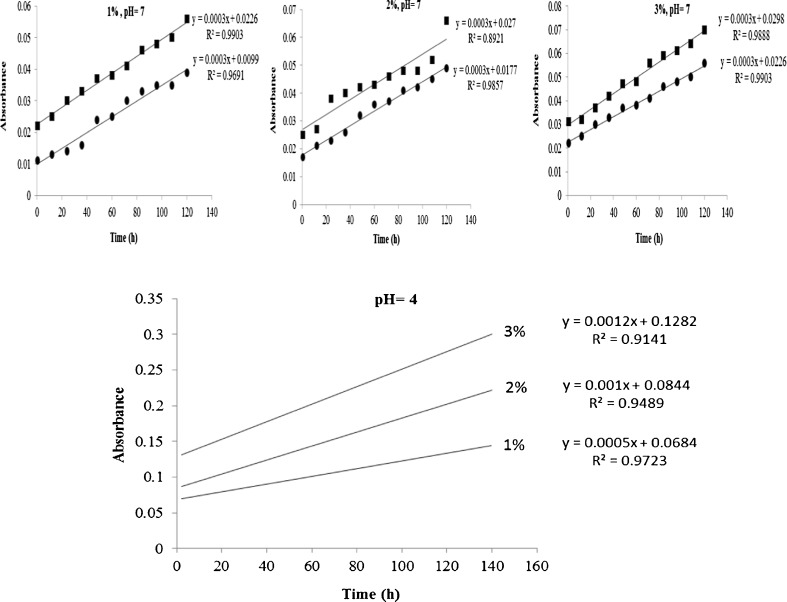
Fig. 1.
Upper panel: absorbance at 640 nm of native (filled circle) and alcoholic-alkaline modified (filled square) starches suspensions at different concentrations (1, 2 and 3 %) at their rudiment pH 7.0; lower panel: absorbance at 640 nm of native starch suspensions at different concentrations; 1 %, 2 % and 3 % in acidic condition (pH = 4)

