Fig. 3.

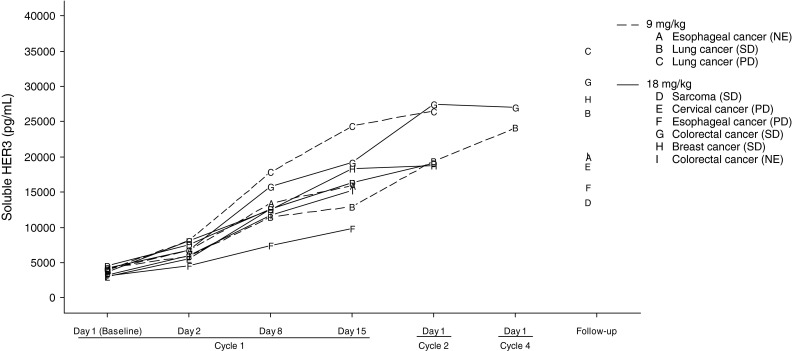
Soluble HER3 concentration in serum, A–I represent individual patients followed by tumor types and best response inside parenthesis

Soluble HER3 concentration in serum, A–I represent individual patients followed by tumor types and best response inside parenthesis