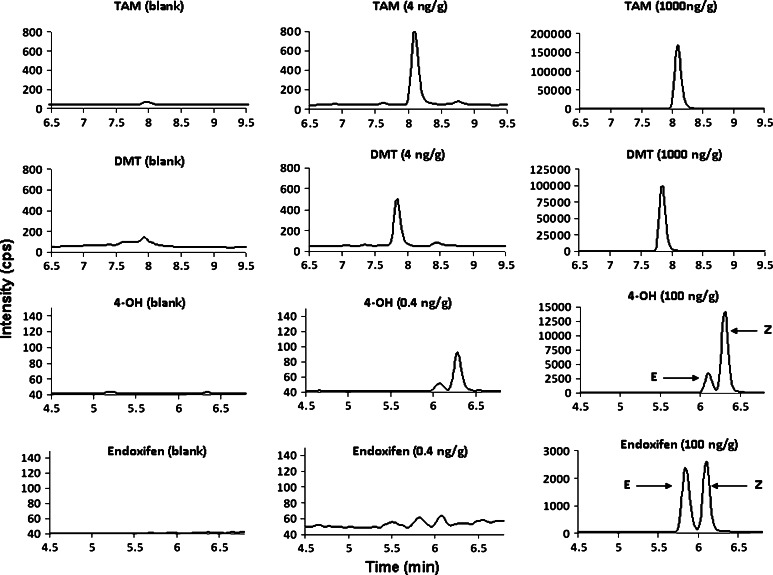
Fig. 1.
Representative MRM chromatograms of each analyte spiked at LOQ (0.4 ng/g for 4-OH and endoxifen and 4 ng/g for TAM and DMT, 2nd column panel) and QC levels (100 ng/g for 4-OH and endoxifen and 1,000 ng/g for TAM and DMT, 3rd column panel) in non-TAM FFPE tissues, and their corresponding blanks (1st column panel)

