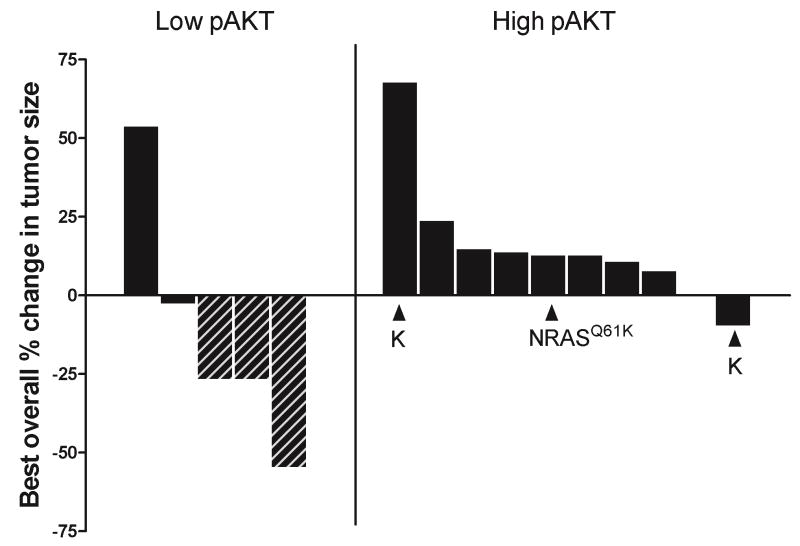
Figure 1.
Waterfall plot showing best overall. Each bar represents an individual patient. The low pAKT cohort is shown on the left; the high pAKT cohort is shown on the right. Hatched bars show patients who experienced tumor shrinkage of at least 25%. All melanomas had a BRAFV600E mutation except for two patients who had melanomas with a BRAFV600K mutation (indicated by K) and one patient who had a melanoma with a NRASQ61K mutation (as indicated).

