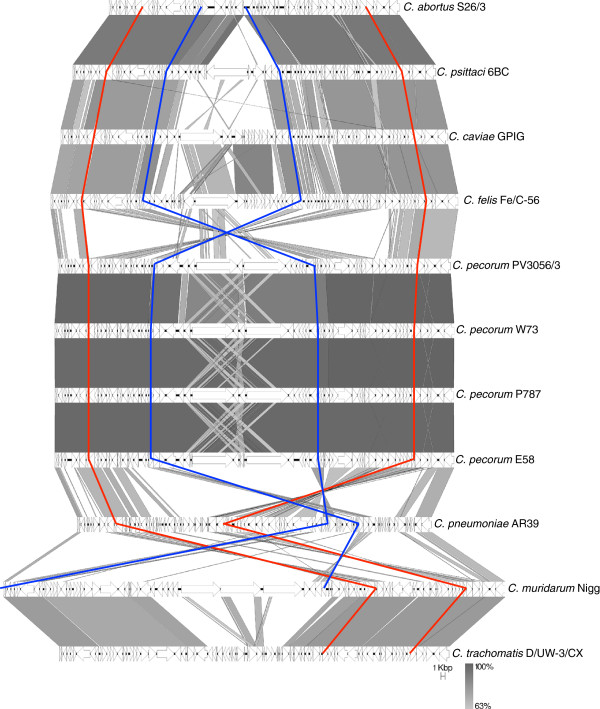
Figure 3.

Comparison of genomic regions flanking the C. pecorum plasticity zone. Comparison of nucleotide matches (computed using blastn) between the genes encoding glucose-6-phosphate 1-dehydrogenase and a peptide ABC transporter (indicated by red vertical lines) for available representative genomes of the family Chlamydiaceae. CDSs are marked as arrows. The blue vertical line represents the plasticity zone defined as the regions between accB and guaB. The depth of shading is indicative of the percentage blastn match, as indicated bottom right. The scale is marked in kilobase pairs.
