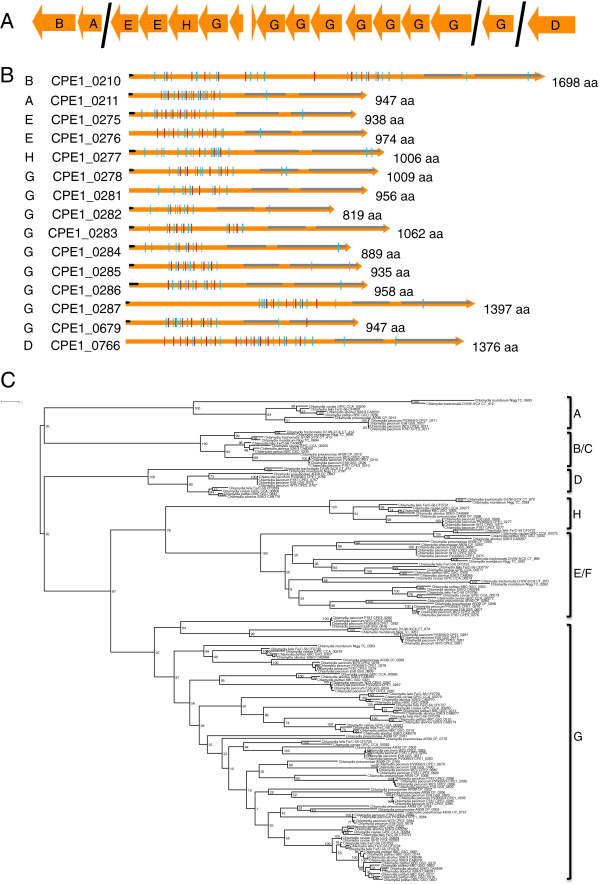
Figure 6.

Polymorphic membrane proteins in C. pecorum . (A) Genetic organisation of Pmps in C. pecorum with gene families (as indicated) identified following BLAST and phylogenetic comparison (see C. below) with other published Pmps. (B) Schematic diagram showing the conserved Pmp features, comprising: predicted pmpM and autotransporter domains (grey arrows); predicted pmp passenger domain repeat motifs GG[A/L/V/I][I/L/V/Y] (blue vertical lines); and FXXN motifs (red vertical lines). Signal peptide sequences are as indicated (black arrows). The predicted number of amino acids (aa) is indicated to the right of the gene. Gene families (see C. below) are indicated to the left of the locus tags. (C) Maximum-likelihood (PhyML) phylogenetic tree of autotransporter domains showing clustering of Pmps into gene families (indicated to the right of the groups). For clarity the figure shown displays a subset of 121 sequences based on a larger alignment of 367 sequences. Trees were calculated using a JTT + I + G substitution model. Bootstrap support is indicated by number at the node. The scale bar indicates 0.1 expected substitutions per site.
