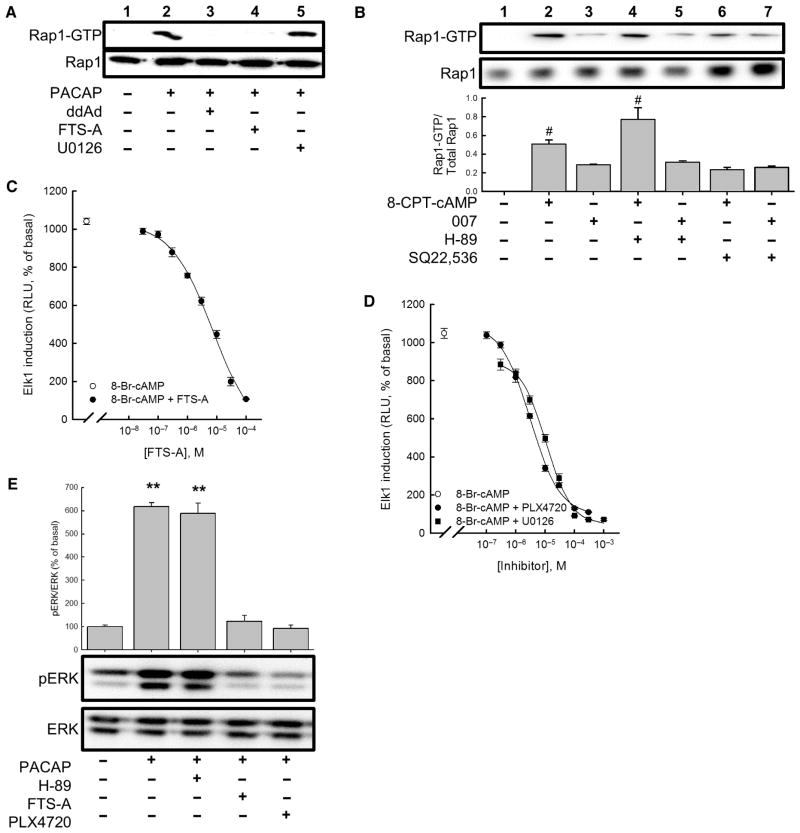
Fig. 2. Rap1 and B-Raf mediate cAMP-dependent activation of ERK.
(A) Measurement of Rap1 activation in NS-1 cells pretreated with vehicle, 100 μM ddAd, 30 μM FTS-A, or 10 μM U0126 before being treated with vehicle or 100 nM PACAP-38 for 5 min. (B) Measurement of Rap1 activation in cells treated with either 100 μM 8-CPT-cAMP or 100 μM 8-CPT-2′-O-Me-cAMP (007) in the presence or absence of 30 μM H-89, 1 mM SQ22,536, or both. Western blotting data are representative of four experiments. Bar graph shows the mean ratios of the abundance of activated Rap1 (Rap1-GTP) to that of total Rap1 protein in each sample and are expressed relative to the amount of activated Rap1 in untreated control cells. #P < 0.05 (Bonferroni). (C) FTS-A inhibited activation of a reporter gene for Elk1 after treatment with 8-Br-cAMP (500 μM). (D) Inhibition of 8-Br-cAMP–dependent Elk1 induction in NS-1 cells by the B-Raf inhibitor PLX4720 and the MEK inhibitor U0126. Points represent means from three experiments, and error bars correspond to SEM. (E) Analysis of ERK activation. NS-1 cells were pretreated with vehicle, 30 μM FTS-A, 10 μM PLX4720, or 30 μM H-89 before being treated with vehicle or 100 nM PACAP-38 for 10 min, and the extent of ERK phosphorylation was determined by Western blotting analysis with antibodies against the indicated proteins. Western blots are representative of four experiments. Bar graph shows the ratio of the abundance of pERK to that of total ERK protein for each sample relative to untreated control cells (set at 100%). **P < 0.01 (Bonferroni), compared to untreated controls.

