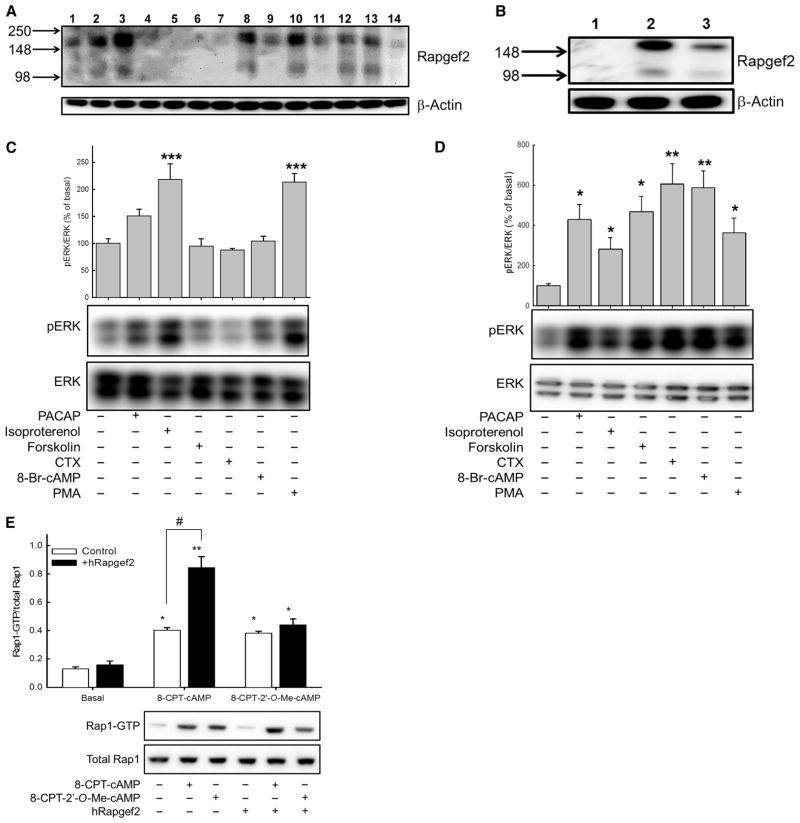
Fig. 4. Rapgef2 protein abundance is enriched in neuroendocrine cells, and its exogenous expression in HEK 293T cells confers cAMP-ERK signaling.
(A) Profile of Rapgef2 protein abundance in human and rodent cell lines. Lane 1: PC12-G; lane 2: NS-1; lane 3: BCC; lane 4: 293T rPAC1hop; lane 5: HEK 293FT; lane 6: HeLa; lane 7: 3T3 Swiss; lane 8: SH-SY5Y; lane 9: NG108-15; lane 10: NBFL; lane 11: FRTL-5; lane 12: B16-F10; lane 13: AtT20; lane 14: Chinese hamster ovary (CHO) K1. Western blotting data are representative of three independent experiments. (B) Western blotting analysis of Rapgef2 abundance in HEK 293T rPAC1hop cells (lane 1), HEK 293T rPAC1hop cells stably expressing hRapgef2 (lane 2), and nontransduced SH-SY5Y cells (lane 3). Western blotting data are representative of three independent experiments. (C and D) Measurement of ERK phosphorylation in (C) 293T rPAC1hop cells and (D) 293T rPAC1hop cells expressing hRapgef2 after treatment for 10 min with 100 nM PACAP-38, 30 μM isoproterenol, 25 μM forskolin, cholera toxin (CTX; 50 μg/ml), 0.5 mM 8-Br-cAMP, or 100 nM PMA. Bar graphs show the ratio of the abundance of pERK to that of total ERK protein for each sample relative to untreated control cells (set at 100%). *P < 0.05, **P < 0.01, ***P < 0.001; n = 4 experiments. (E) Analysis of Rap1 activation in 293T rPAC1hop cells expressing or not expressing the retroviral vector encoding hRapgef2. Cells were treated with vehicle, 100 μM 8-CPT-cAMP, or 100 μM 8-CPT-2′-O-Me-cAMP. *P < 0.05, **P < 0.01, compared to vehicle-treated cells. In cells expressing hRapgef2, 8-CPT-cAMP conferred a significantly greater activation of Rap1 (**P < 0.01) than was observed in nontransduced cells (#P < 0.05, Bonferroni). Data are from four to six independent experiments.

