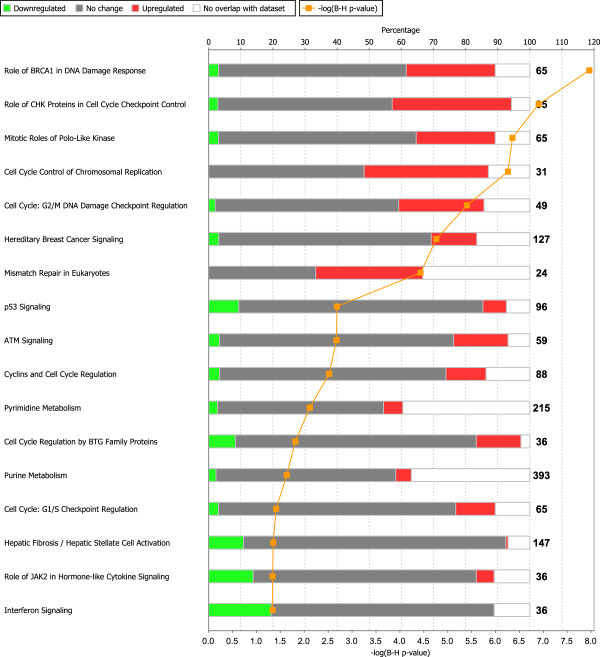
Figure 2.
Significantly affected pathways in osteosarcoma cells. Stacked bar chart depicting all significantly affected pathways as identified by gene expression profiling of osteosarcoma cell lines, showing percentages of up- (red), downregulated (green), not significantly altered genes (gray), and genes which were not present on the microarray (white). The –log(adjP) (−log(B-H) p-value) is plotted in orange, and is above 1.3 for adjP < 0.05.

