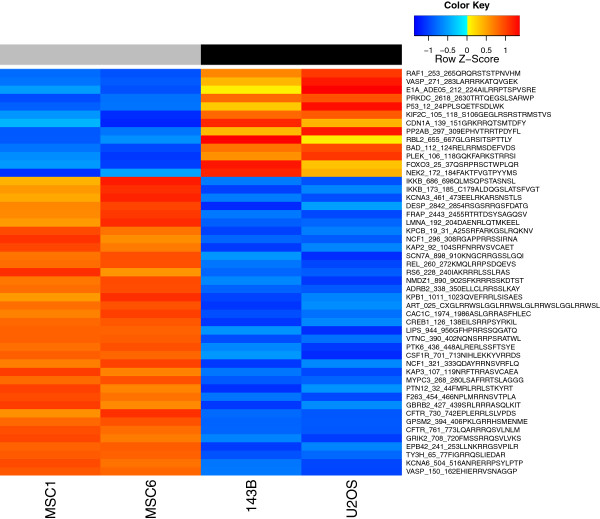
Figure 3.
Supervised clustering of kinome profiling results. Supervised clustering on all 49 significantly differentially phosphorylated peptides identified by the comparison of two osteosarcoma cell lines with two MSC cultures. Peptides are sorted on logFC, from lower phosphorylation to higher phosphorylation in osteosarcoma cell lines. Orange: higher phosphorylation levels, blue: lower phosphorylation levels.

