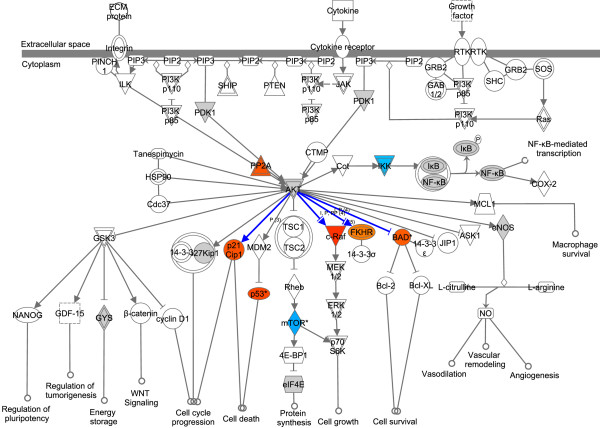
Figure 5.
Akt signaling pathway. The Akt signaling pathway in IPA. Blue: significantly lower, orange: significantly higher phosphorylation in osteosarcoma cell lines, gray, no significant difference in phosphorylation, white: no phosphorylation sites of the particular protein on the PamGene Ser/Thr chip. Blue lines indicate known downstream phosphorylation by the upstream kinase.

