
Figure 2. Flow chart of index children enrolled in the POGO study.
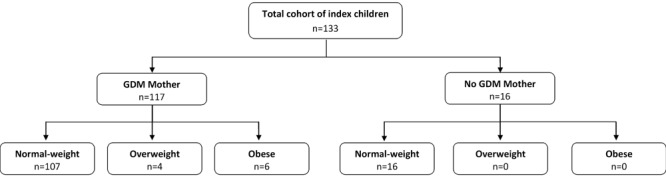
Normal-weight, overweight (excluding obesity), and obesity refer to the values at study visit or last height and weight measurement before study visit.
Official websites use .gov
A
.gov website belongs to an official
government organization in the United States.
Secure .gov websites use HTTPS
A lock (
) or https:// means you've safely
connected to the .gov website. Share sensitive
information only on official, secure websites.
Normal-weight, overweight (excluding obesity), and obesity refer to the values at study visit or last height and weight measurement before study visit.