
Figure 1.
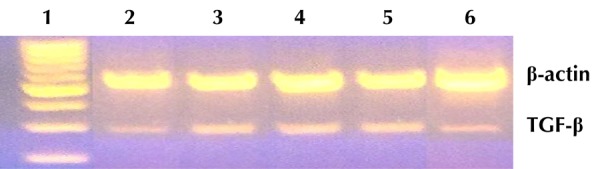
Representative agarose gel electrophoresis profiles of TGF-β mRNA amplification stained with ethidium bromide where: (1) DNA Marker, (2) control, (3, 4) diabetic patients in group A before and after treatment, (5, 6) diabetic patient in group B before and after ALA treatment.