
Figure 2. Ratio of the optical density (OD) of samples to the corresponding housekeeping gene (β-actin).
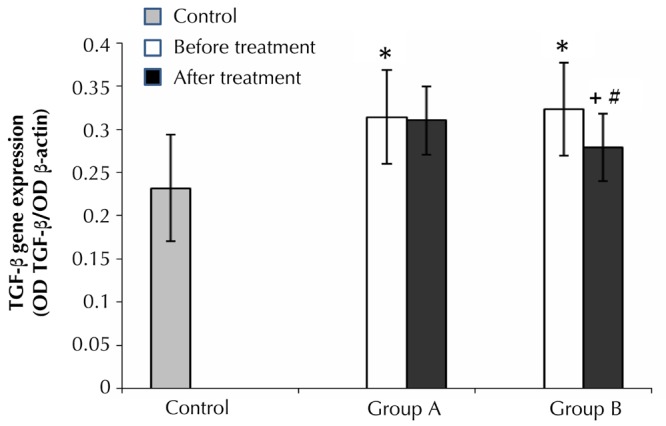
Each point represents the mean ± SD. * Indicates a significant difference compared with the control group (p < 0.05). + Indicates a significant difference after treatment compared with their respective values before treatment (p < 0.05). # indicates a significant difference compared with group A after treatment (p < 0.05). Group A: diabetic patients given insulin alone. Group B: diabetic patients given insulin plus ALA 300 mg twice daily.