
Table 4. Echocardiographic data of patient groups and controls before and after drug treatment.
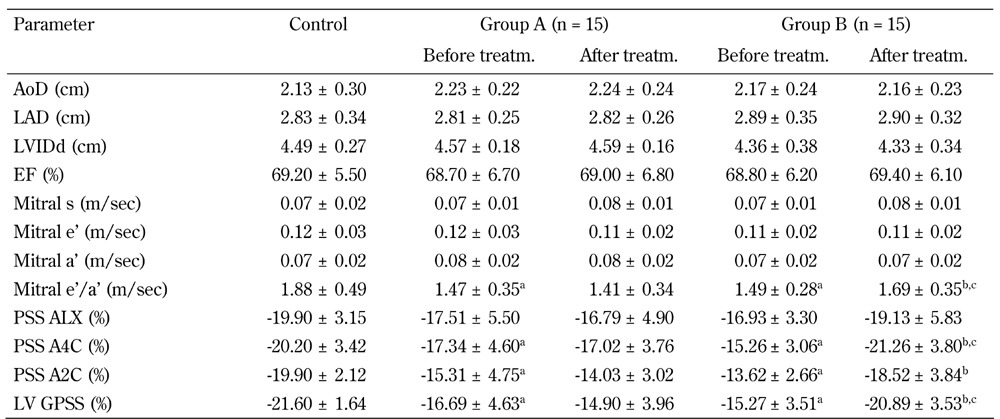
Legend: Data are means ± SD. Group A: diabetic patients given insulin alone. Group B: diabetic patients given insulin plus ALA 300 mg twice daily. a Significant different compared with controls (p < 0.05). b Significant different after treatment compared with their respective values before treatment (p < 0.05). c Significant different compared with group A after treatment (p < 0.05). Abbreviations: AoD – aortic dimension, LAD – left atrial dimension, LVIDd – left ventricular internal diastolic dimension, EF – ejection fraction, s – tissue Doppler peak mitral annulus systolic velocity, e' – early diastolic mitral annular velocity, a' – peak velocity of mitral annular motion during atrial contraction, PSS ALX – peak systolic strain in apical long axis view, PSS A4C – peak systolic strain in apical 4 chamber view, PSS A2C – peak systolic strain in apical 2 chamber view, LV GPSS – left ventricular global peak systolic strain.