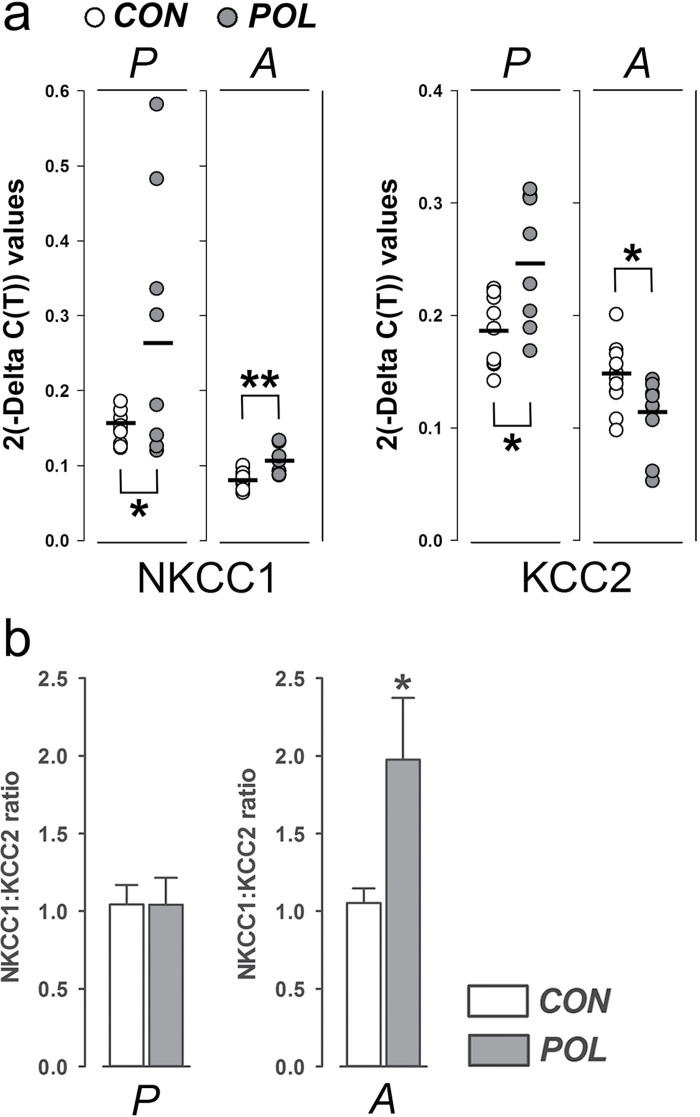
Fig. 3.
Analysis of NKCC1 and KCC2 mRNA levels in prefrontal cortex following prenatal immune activation. (a) The graph depicts the 2(-Delta C(T)) values of the sodium-potassium-chloride cotransporter 1 (NKCC1) and the potassium-chloride cotransporter 2 (KCC2) measured in each individual control (CON, white symbols) or poly(I:C)-exposed (POL, gray symbols) offspring at peripubertal (P) or adult (A) age. The bars represent the mean of individual 2(-Delta C(T)) values for each group/age. *P < .05 and **P < .01, based on independent Student’s t tests (two-tailed). (b) The bar plots show the means ± standard error mean (SEM) of normalized NKCC1:KCC2 ratios for peripubertal (P) or adult (A) offspring. N(CON/peripuberty) = 9, N(POL/ peripuberty) = 7, N(CON/adulthood) = 11, N(POL/ adulthood) = 9.

