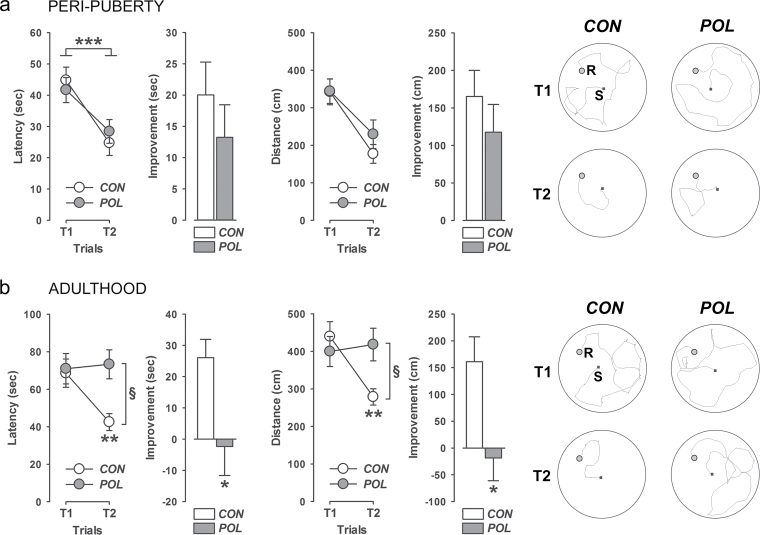
Fig. 4.
Working-memory performance following prenatal immune activation. The line plots show the latency (sec) and distance moved (cm) to find the rewarded hole in trial 1 (T1) and T2, and the bar plots depict the improvement in these measures from T1 to T2. The drawings illustrate computer-generated search path of representative control (CON) and poly(I:C)-exposed (POL) offspring in T1 and T2 of the working memory test. S, Starting position; R, location of the rewarded hole. (a) Working-memory performance in POL and CON offspring at peripubertal age. ***P < .001, reflecting the significant main effect of trials [latency: F (1,25) = 14.63, P < 0.001; distance: F (1,25) = 11.75, P < 0.001] obtained by a 2×2 × 5 (prenatal treatment × trial × day) repeated-measures ANOVA. N(CON) = 13, N(POL) = 14. All values are means ± SEM. (b) Working-memory performance in POL and CON offspring at adult age. **P < .01, reflecting the significant main effect of trials [latency: F (1,16) = 7.92, P < .01; distance: F (1,16) = 8.95, P < .01] in adult CON animals following the presence of a significant prenatal treatment × trial interaction [latency: F (1,29) = 4.58, P < .05; distance: F (1,29) = 6.48, P < .05]; § P < .01, reflecting the significant difference between CON and POL animals in T2 based on post hoc comparisons; *P < .05, reflecting the significant difference between CON and POL animals associated with the significant main effect of prenatal treatment [latency: F (1,29) = 5.01, P < .05; distance: F (1,29) = 5.82, P < .05] obtained by 2×5 (prenatal treatment × day) repeated-measures ANOVA of the improvement scores. N(CON) = 17, N(POL) = 14. All values are means ± SEM.

