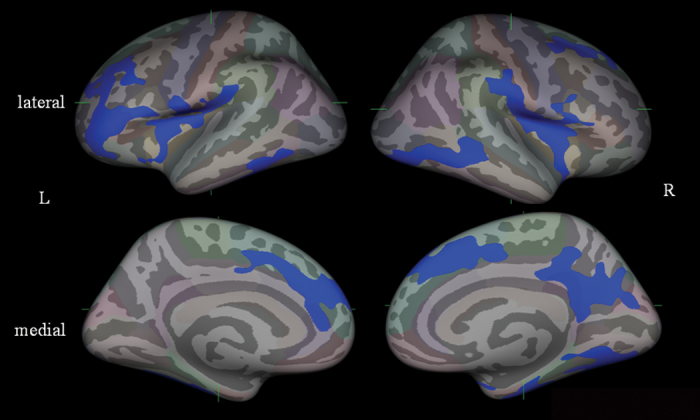
Fig. 1.
Statistical maps on FreeSurfer analysis of group comparison of gray matter cortical thickness between normal control and schizophrenia subjects (Monte Carlo simulation, P < .05). Maps are shown for right and left hemispheres in lateral and medical views, and significant reduction regions in schizophrenia are shown in blue color.

