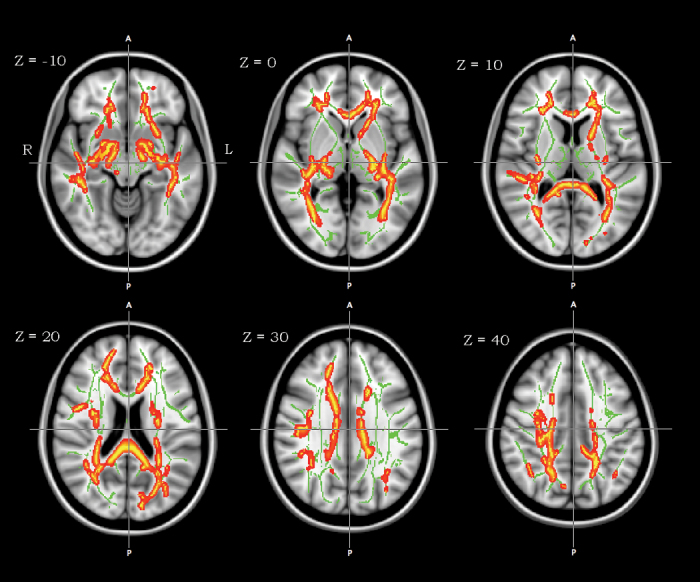
Fig. 2.
Tract-based spatial statistics group comparison of white matter fractional anisotropy (FA) between normal control and schizophrenia subjects (threshold-free cluster enhancement; P < .01). A cluster of significant FA reduction in schizophrenia subjects is shown using the tbss_fill implemented in FSL (red-yellow) on the mean FA map and FA skeleton (green color). Axial slices are from Z = −10 to 40 in Montreal Neurological Institute (MNI) coordinate. Left-right orientation is according to the radiological convention.

